Tutorial
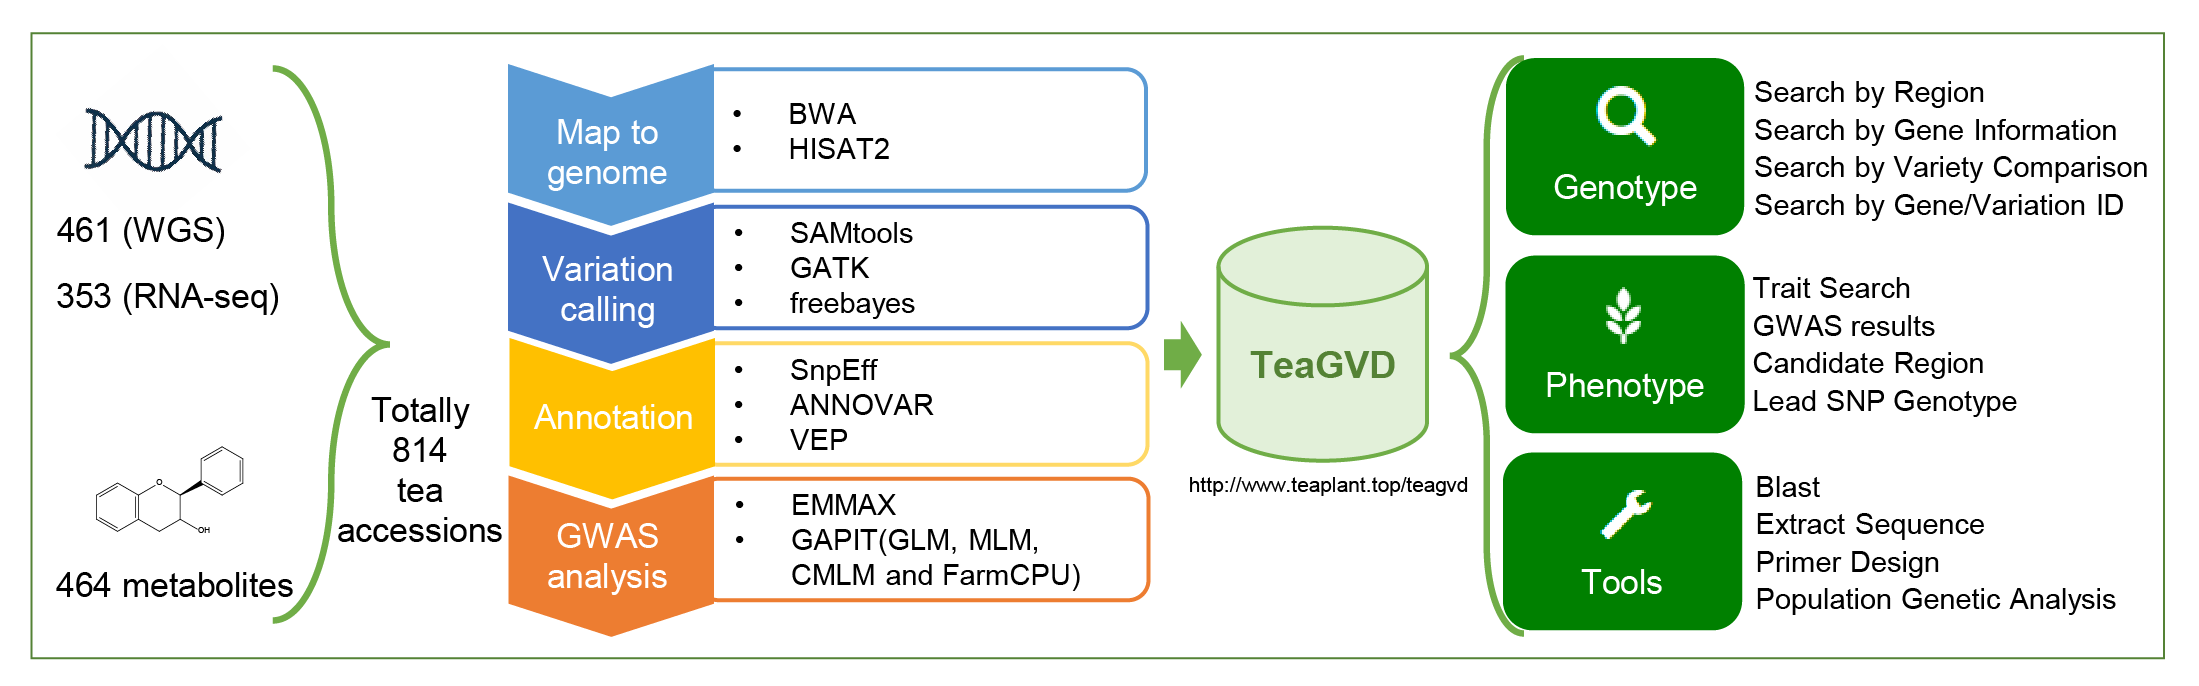
TeaGVD is built and organized into four modules for various data types and applications, including Genotype, Phenotype, Tools and Help module. These modules provides user-friendly web interfaces to retrieve and visualize genomic variations and their related information (gene annotation, gene expression of different tissues, GWAS results, et al.)
Users can specify a genomic coordinate and filtering parameters to retrieve all SNPs/InDels information in the corresponding region, including variation ID, chromosome position, alleles, variant type, minor allele frequency, variation consequence type,et al.
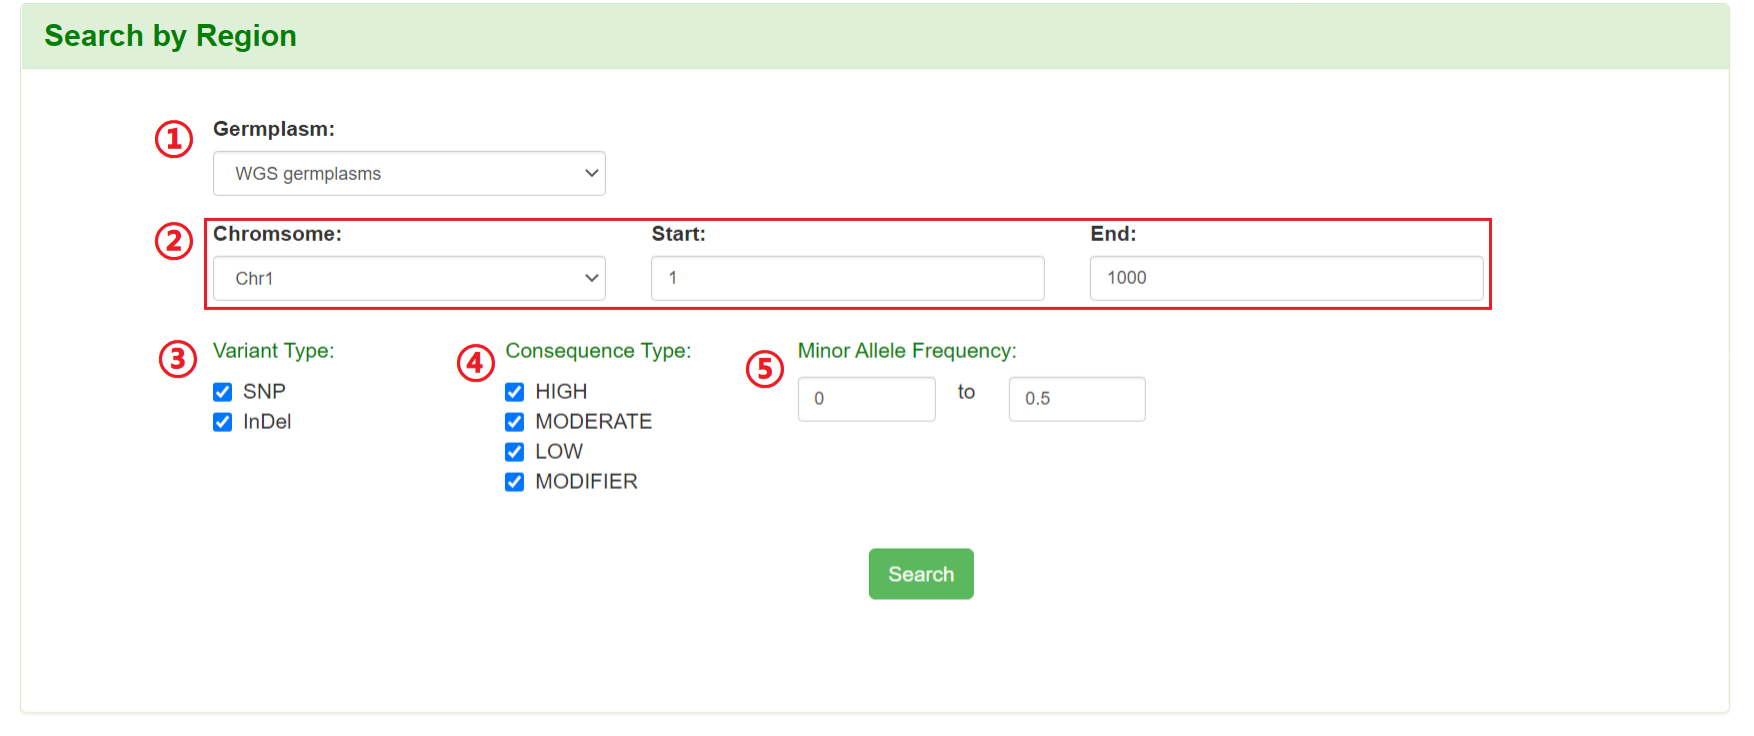
1: Select germplasm (WGS germplasm or RNA-seq germplasm).
2: Specify a chromosome and input a region.
3: Filter the variation by variant type.
4: Filter the variation by four levels of consequence types.
5: Filter the variation by minor allele frequency.
Results of “Search by Region”
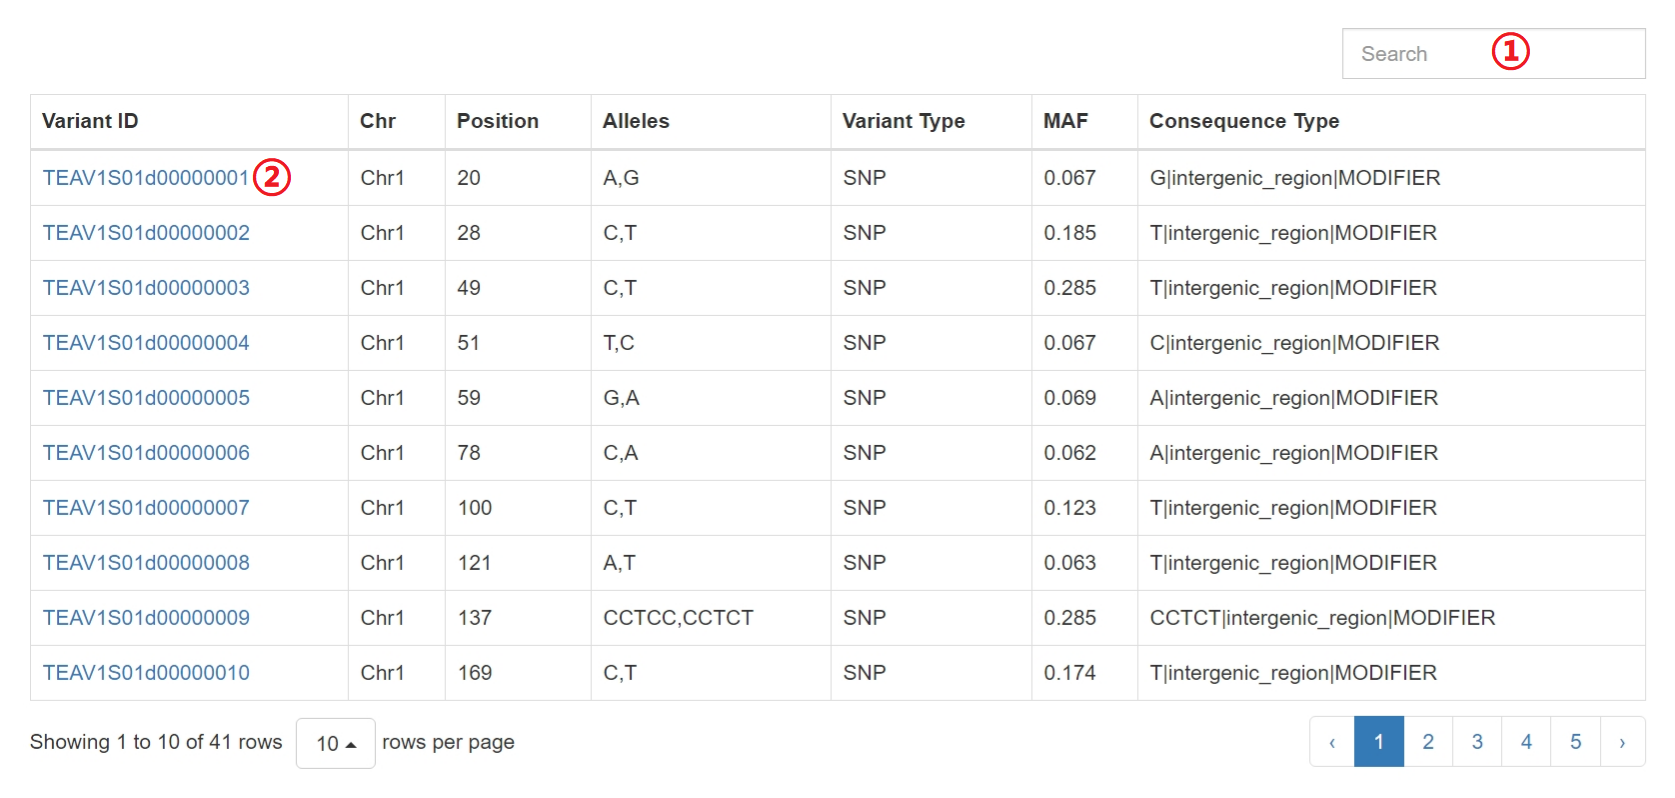
1: Input a keyword to search the table.
2: Click on hyperlinks can jump to variation detail information.
Users can specify a gene ID as well as its upstream and downstream regions or keywords of gene annotation in term of GO, KEGG and Pfam to retrieve all SNPs/InDels information in the corresponding region, including variation ID, chromosome position, alleles, variant type, minor allele frequency, gene ID, variation consequence type,et al.
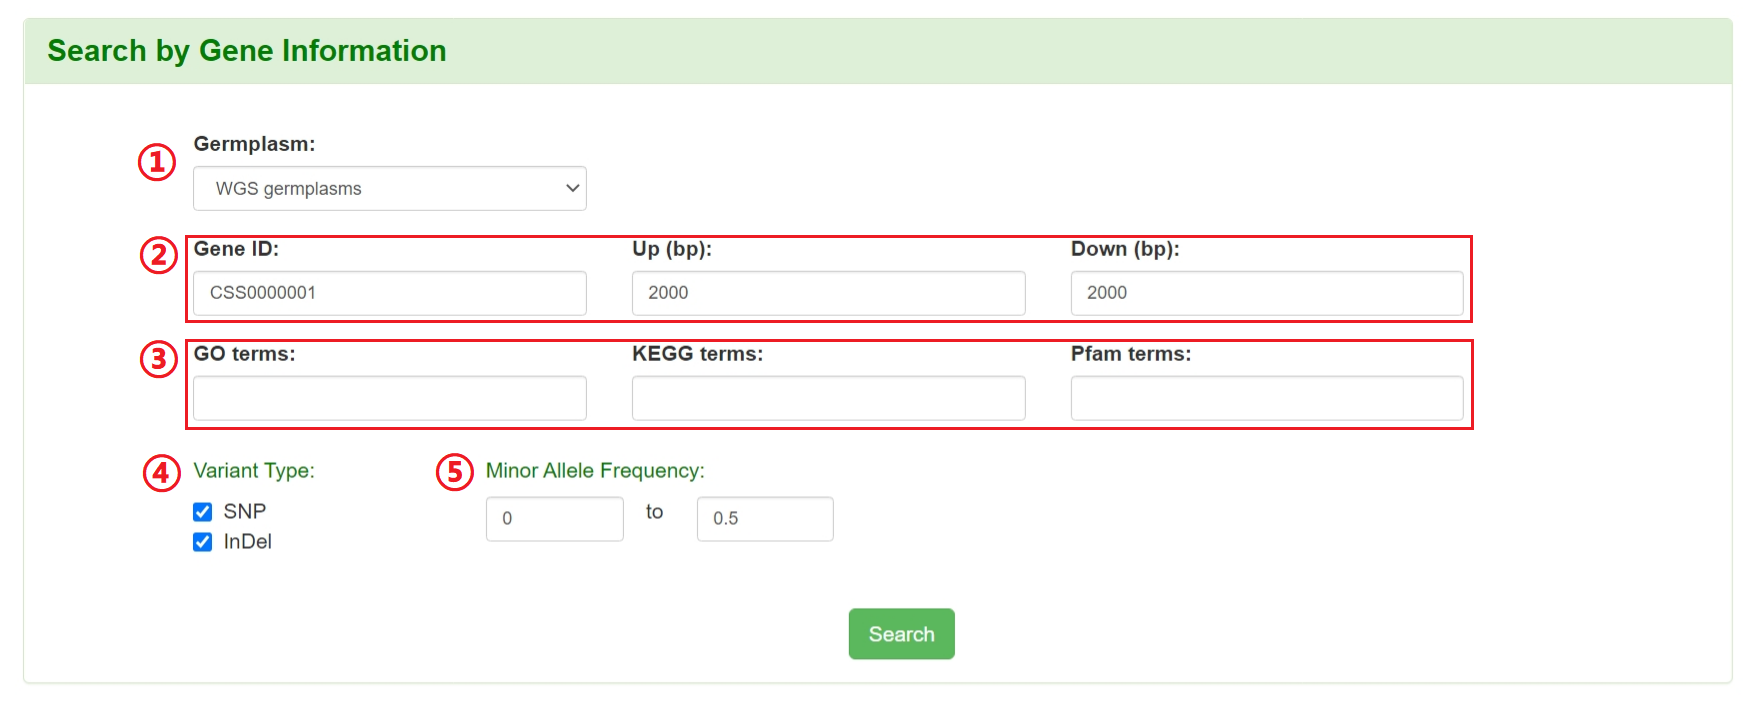
1: Select germplasm (WGS germplasms or RNA-seq germplasms).
2: Input a gene ID (ref. shuchazao_V2_ahau, e.g. CSS0000001) and flanking regions.
3: Input a keyword of GO terms, KEGG terms or Pfam term. ( optional, conflict with gene ID)
4: Filter the variation by variant type.
5: Filter the variation by minor allele frequency.
Results of “Search by Gene Information”

1: Input a keyword to search the table.
2: Click on hyperlinks can jump to variation detail information.
3: Click on hyperlinks can jump to gene detail information.
Users can retrieve the polymorphic SNPs/InDels between two or more germplasms rapidly by specifying genomic coordinate and tea germplasms of interest.
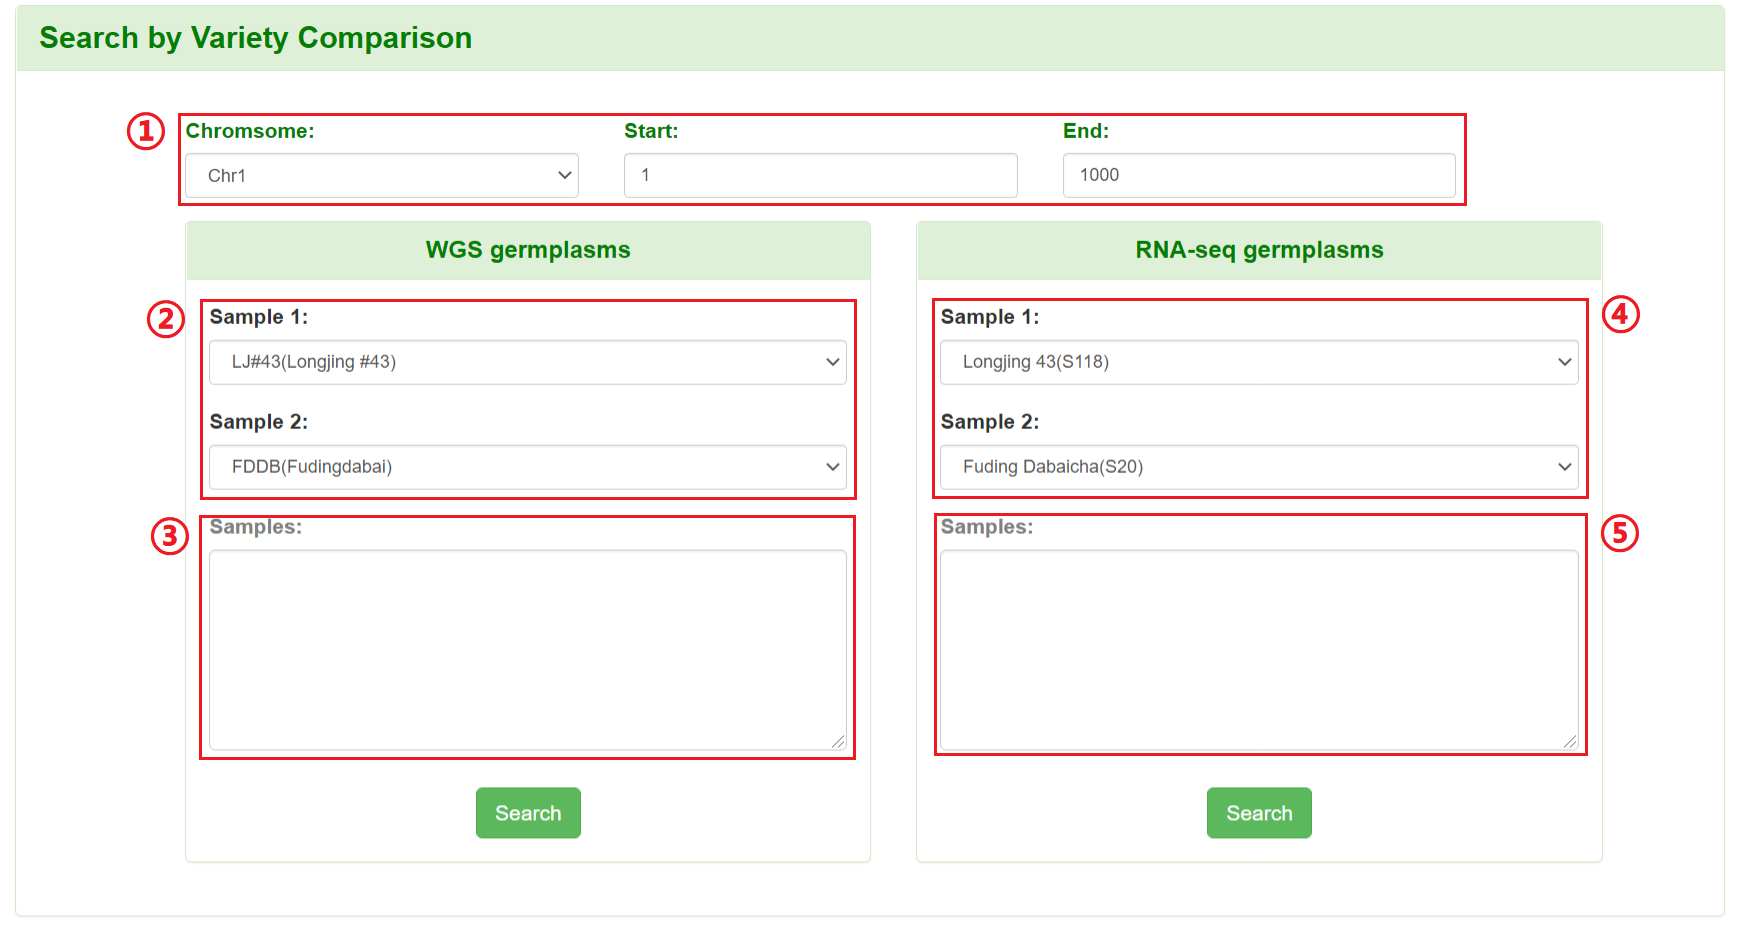
1: Specify a chromosome and input a region.
2: Select two varieties from WGS germplasms to compare.
3: Input more than two varieties (variety IDs) from WGS germplasms to compare. All variety IDs are in Germplasms Information.
4: Select two varieties from RNA-seq germplasms to compare.
5: Input more than two varieties (variety IDs) from RNA-seq germplasms to compare. All variety IDs are in Germplasms Information.
Results of “Search by Variety Comparison”
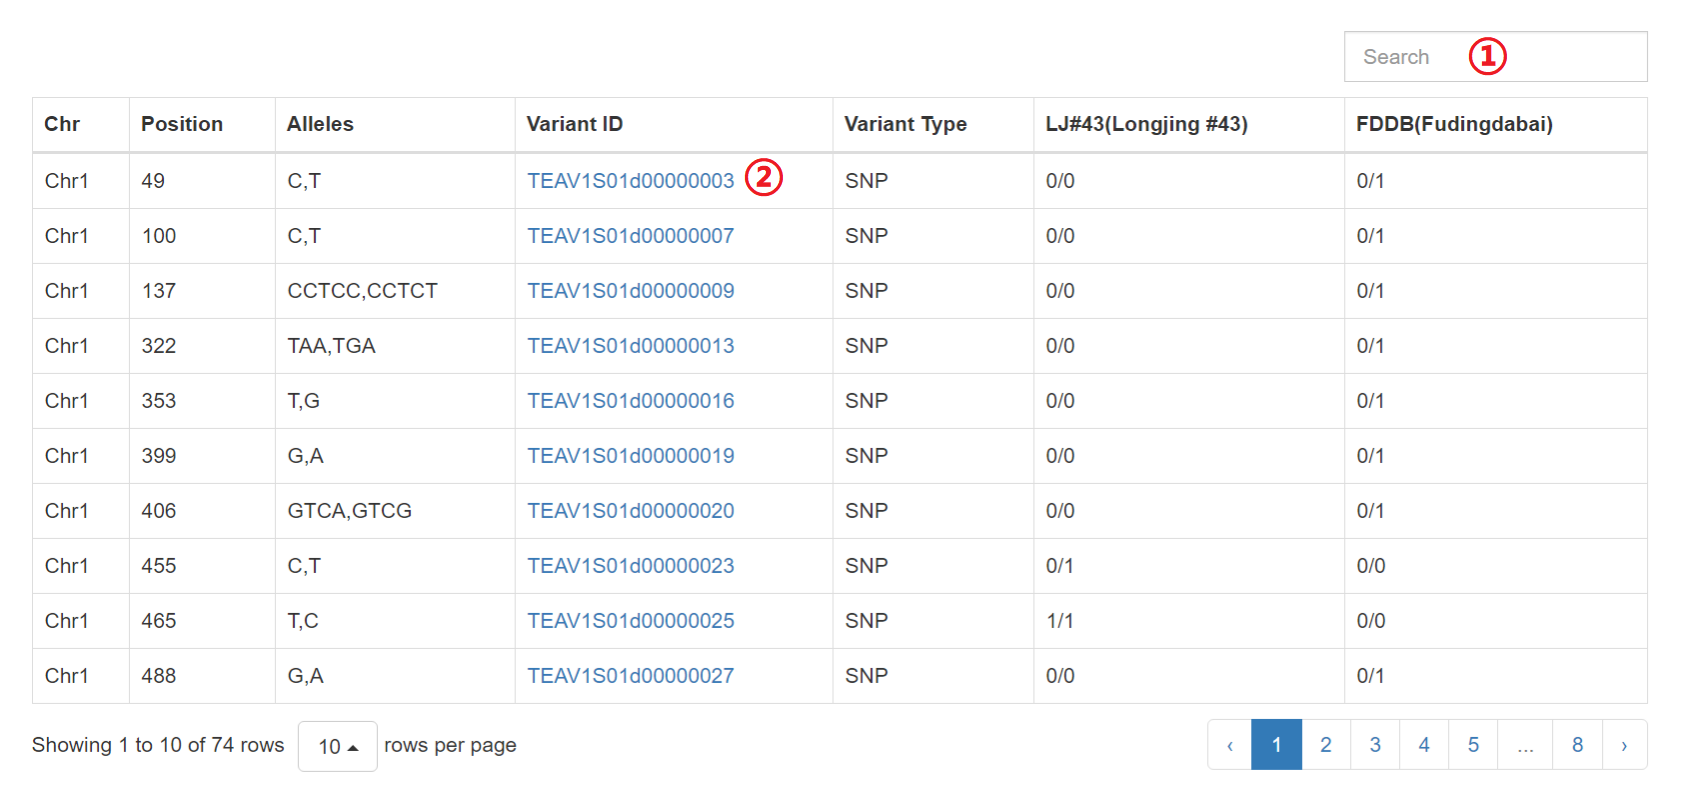
1: Input a keyword to search the table.
2: Click on hyperlinks can jump to variation detail information.
Users can search the detail gene or variation information by gene or variation ID.

1: Input a variation ID (e.g. TEAV1S01d00000001, TEAV1S01r00000001) or gene ID (ref. shuchazao_V2_ahau, e.g. CSS0000001).
   Identifier of variation ID:
        {species}{version}{variation type}{chromosome}{sequencing strategy}{number}
            species:             TEA
            version:             V1
            variation type:      “S” for SNP, “I” for InDel
            chromosome:          “01” to “13” for Chr1 to Chr13, 00 for congtigs
            sequencing strategy: “d” for WGS, “r” for RNA-seq
            number:              the number is the rank across chromosome coordinate
Results of “Search by Variation ID”
Variation Information
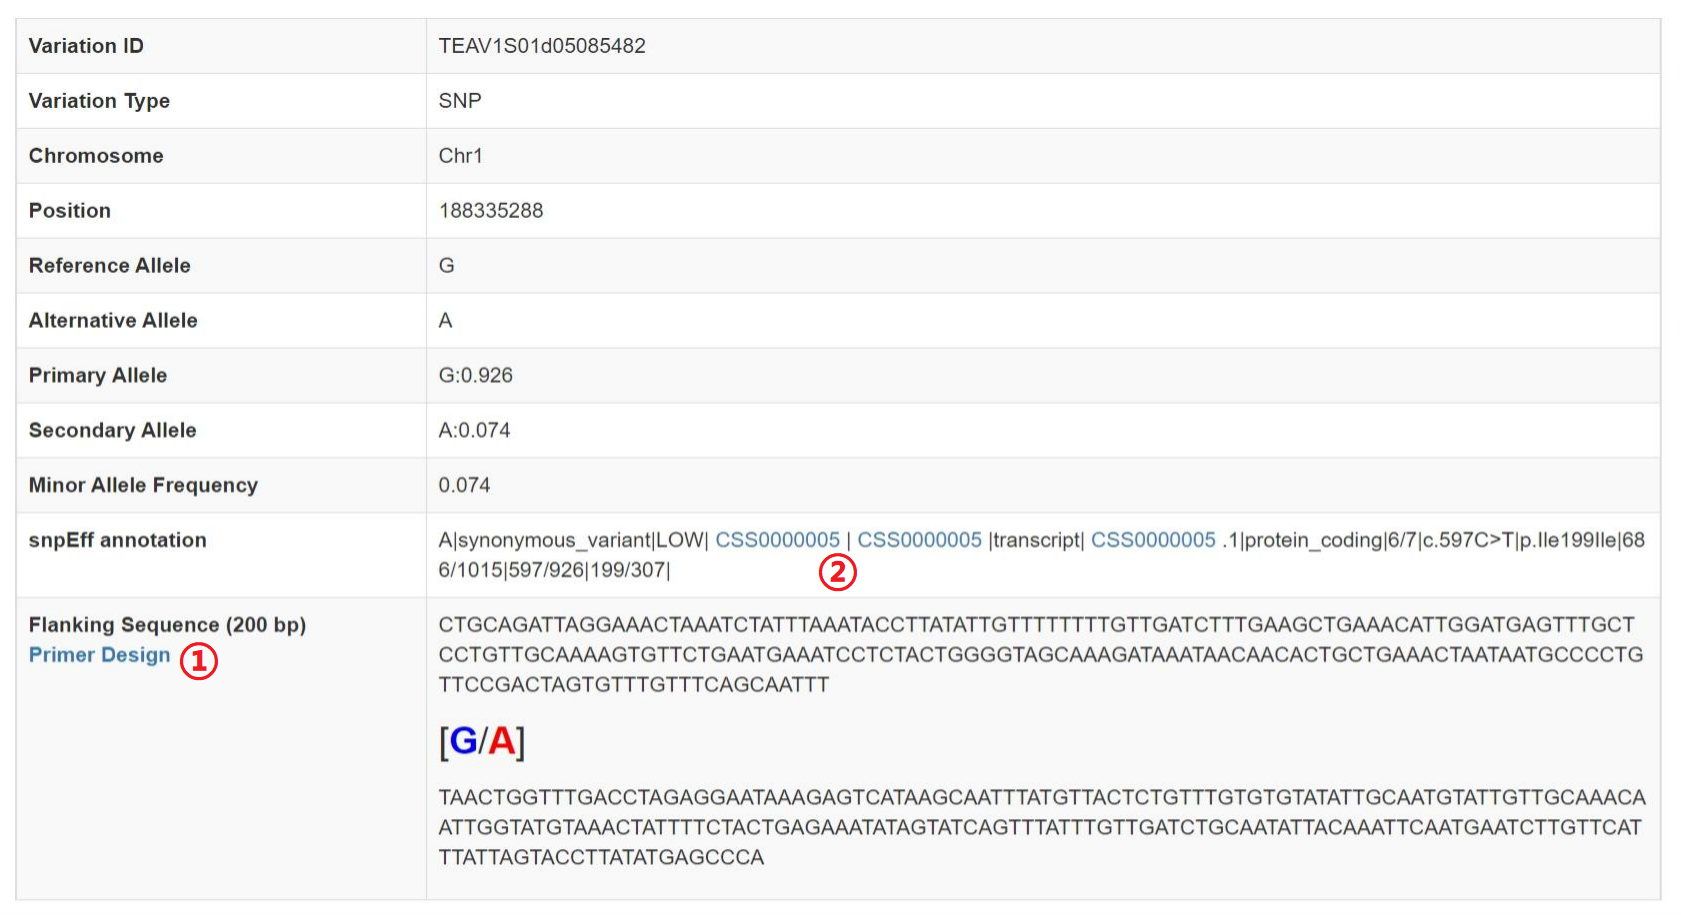
1: Click on hyperlinks can design primer.
2: Click on hyperlinks can jump to gene detail information.
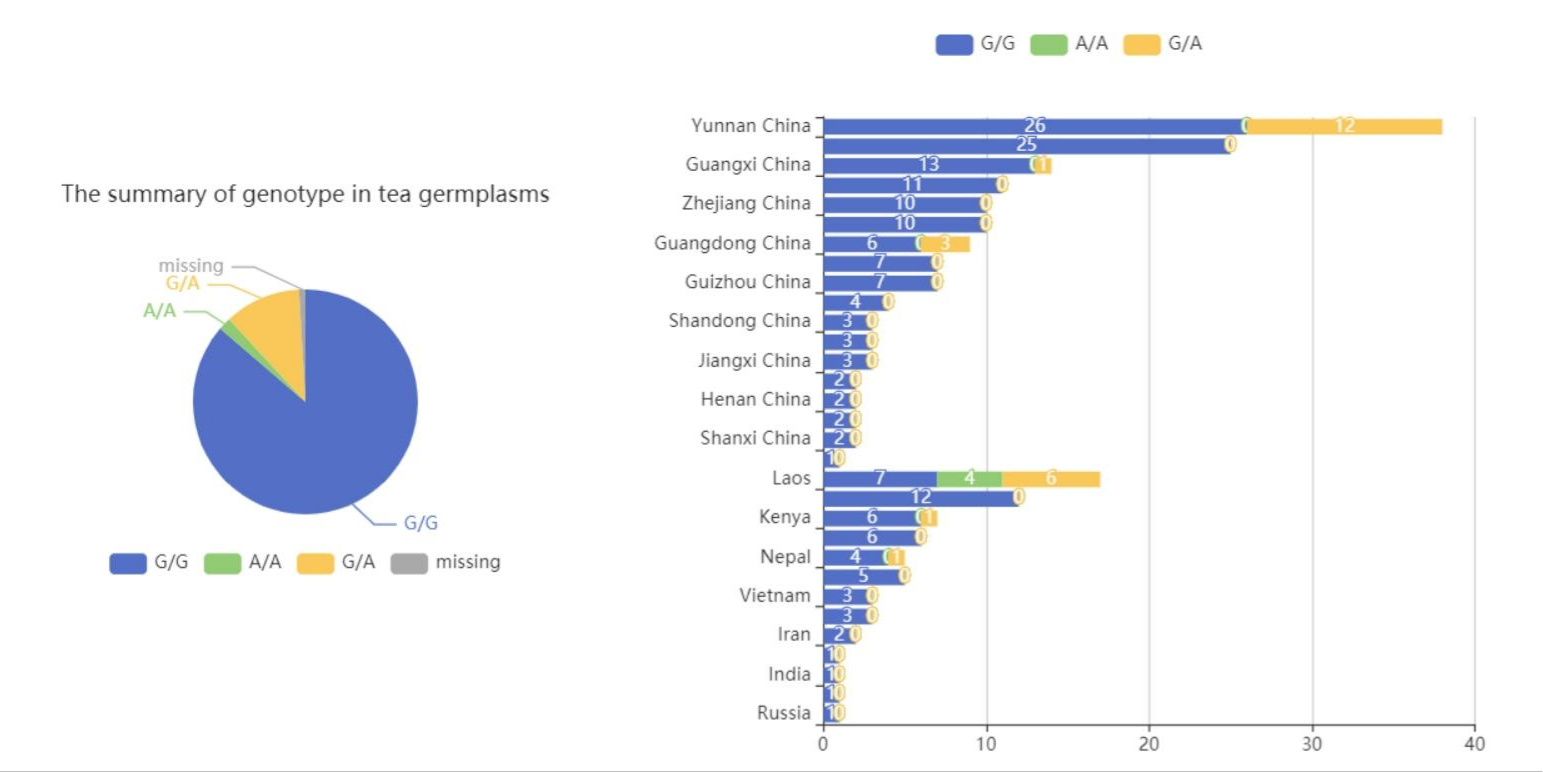
Genotype Distribution
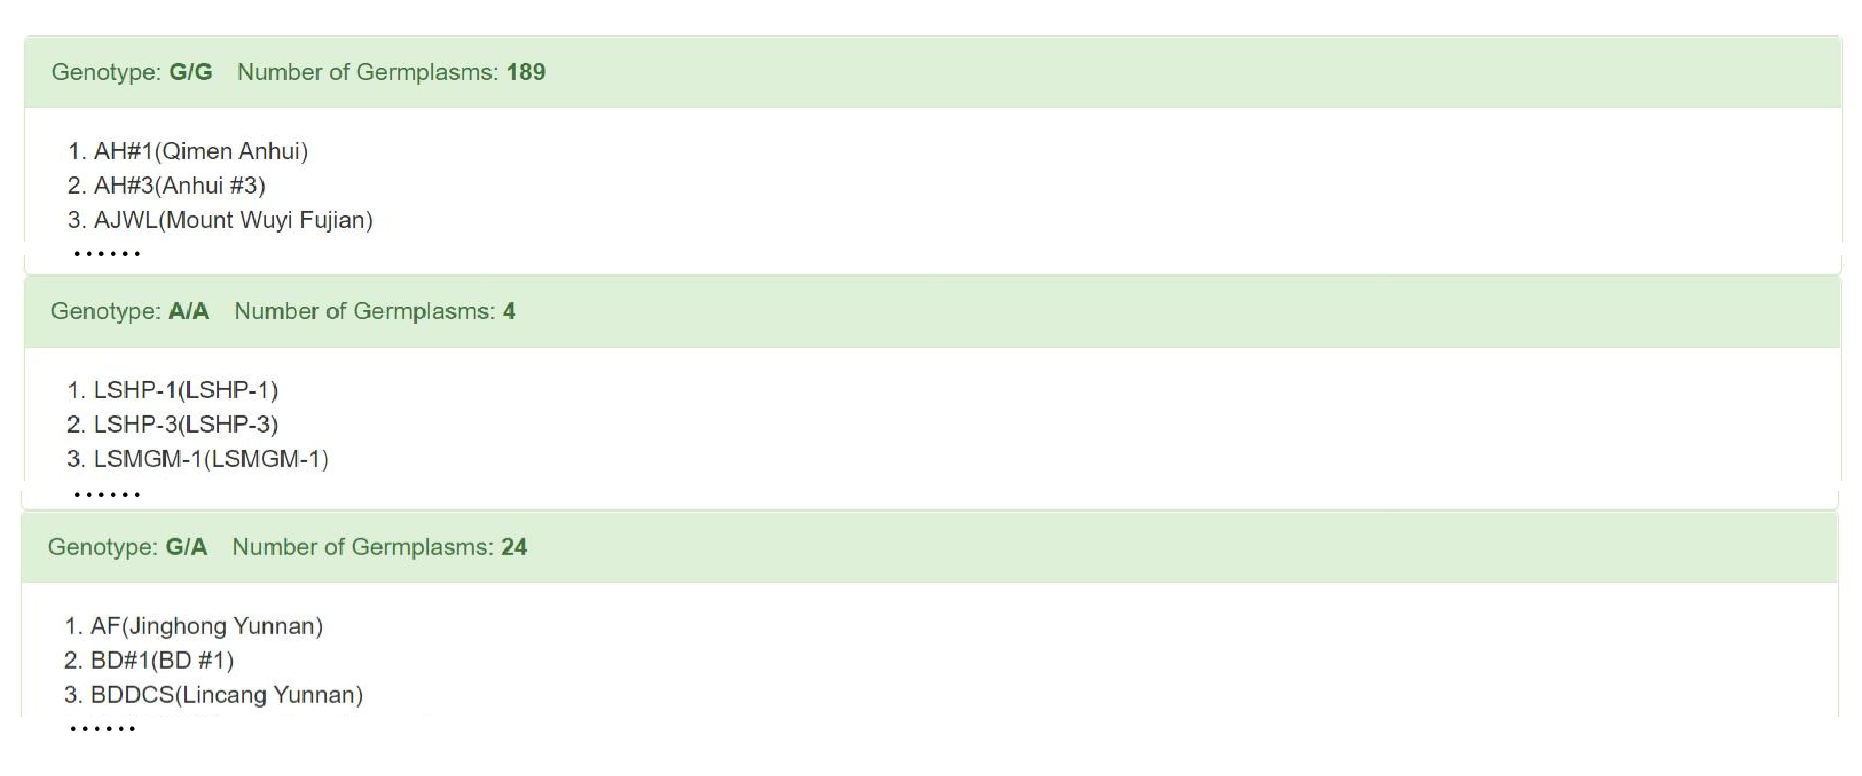
Genotype Information
Results of “Search by Gene ID”
Variation Map
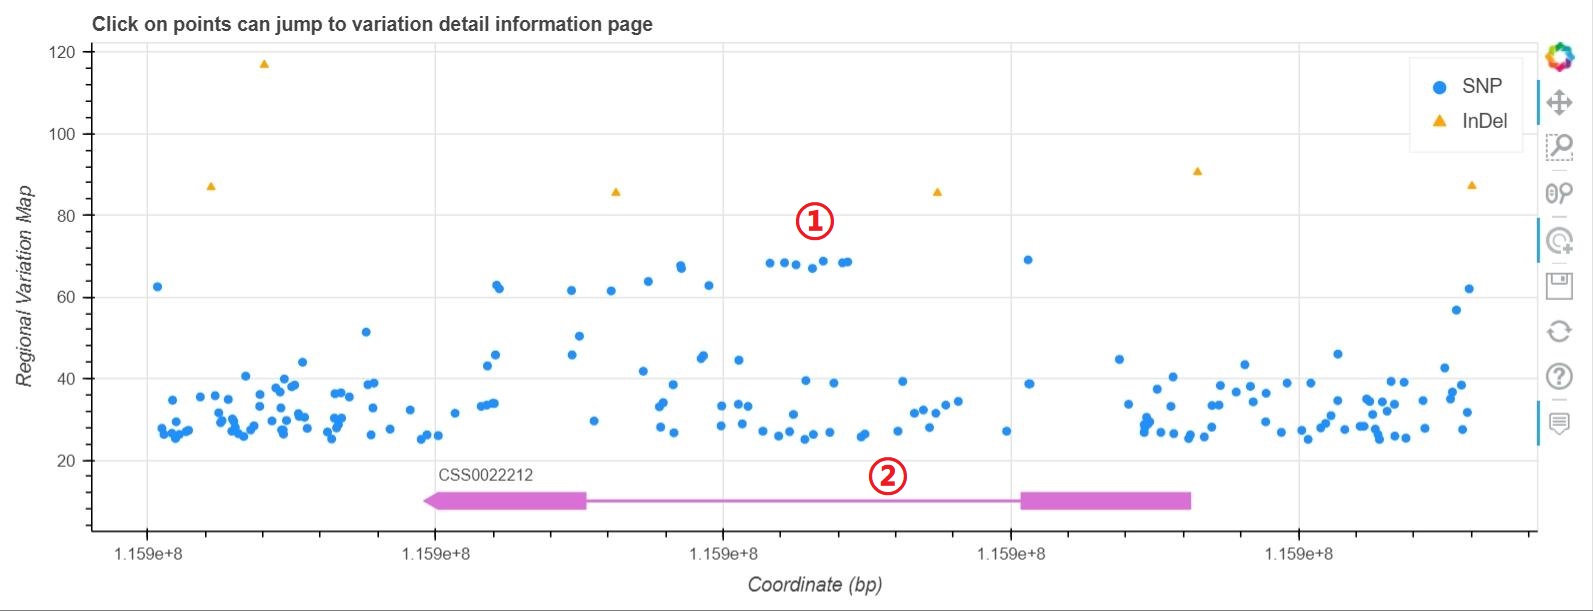
1: Move the mouse can see the basic variation information and click on points can jump to the detail variation information.
2: Display of gene structure.
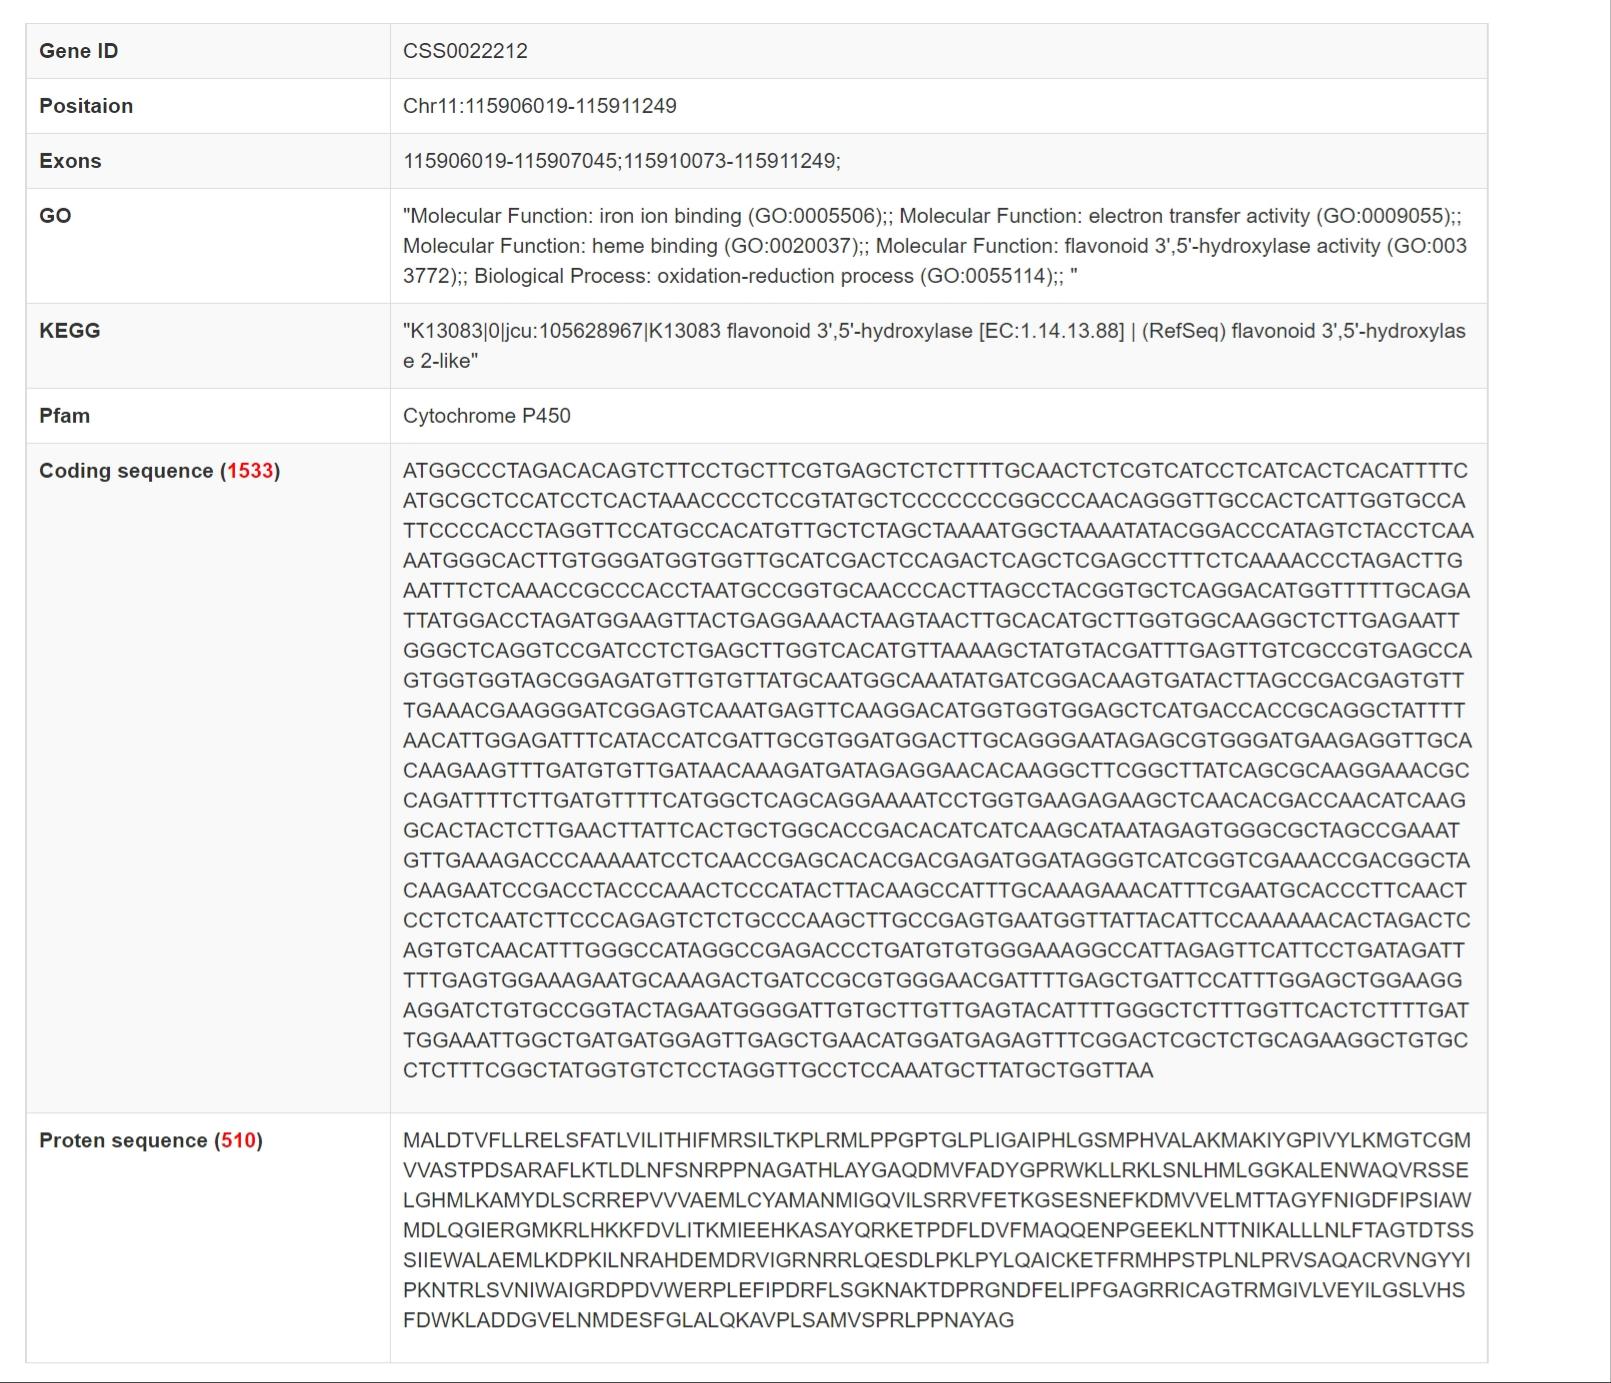
Gene Information
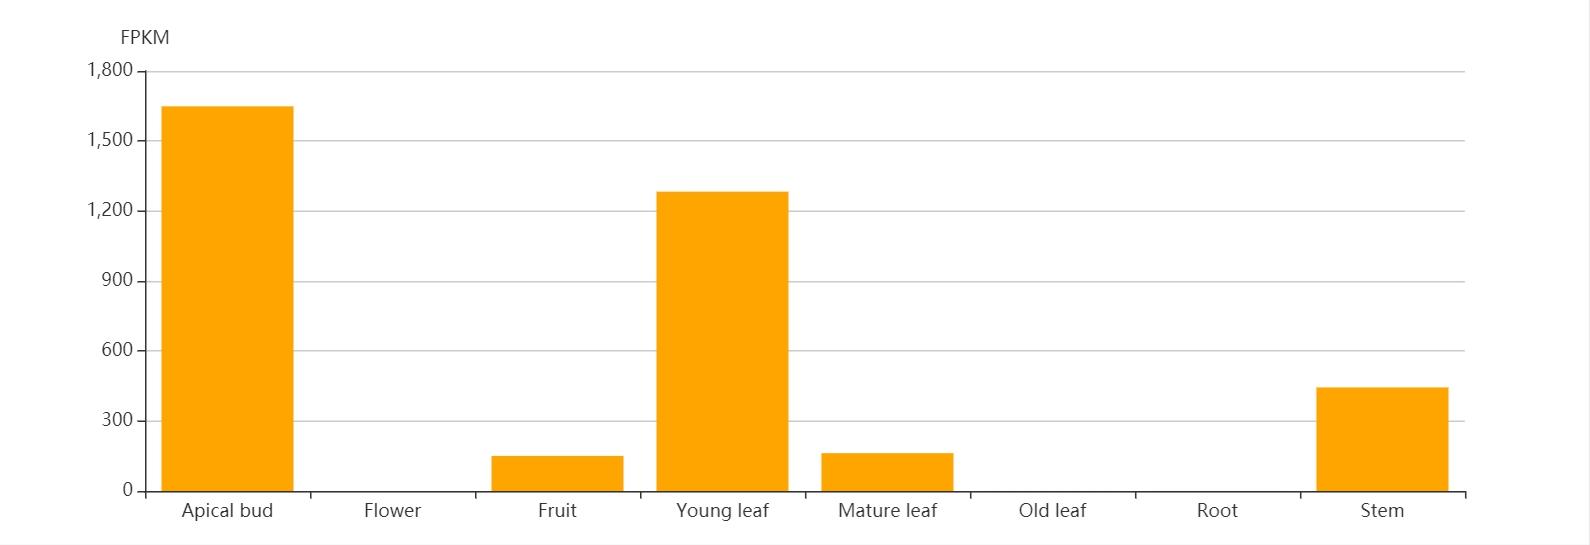
Gene Expression
More than 400 metabolites have been integrated into this module. Users can retrieve the detailed trait value and its distribution of all available tea germplasms for each metabolite.
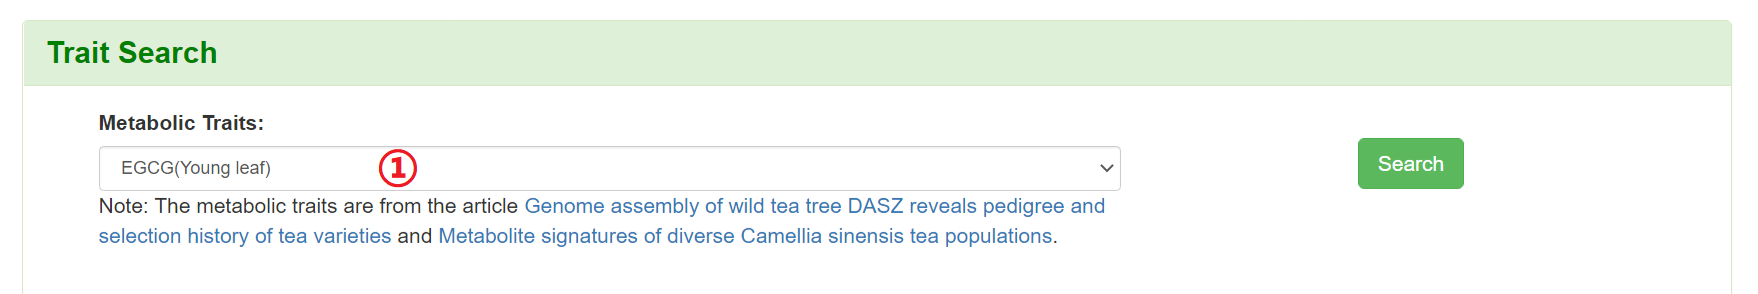
1: Specify a trait of interest. All metabolic traits integrated into the TeaGVD lists in Phenotype Information.
Results of “Trait Search”
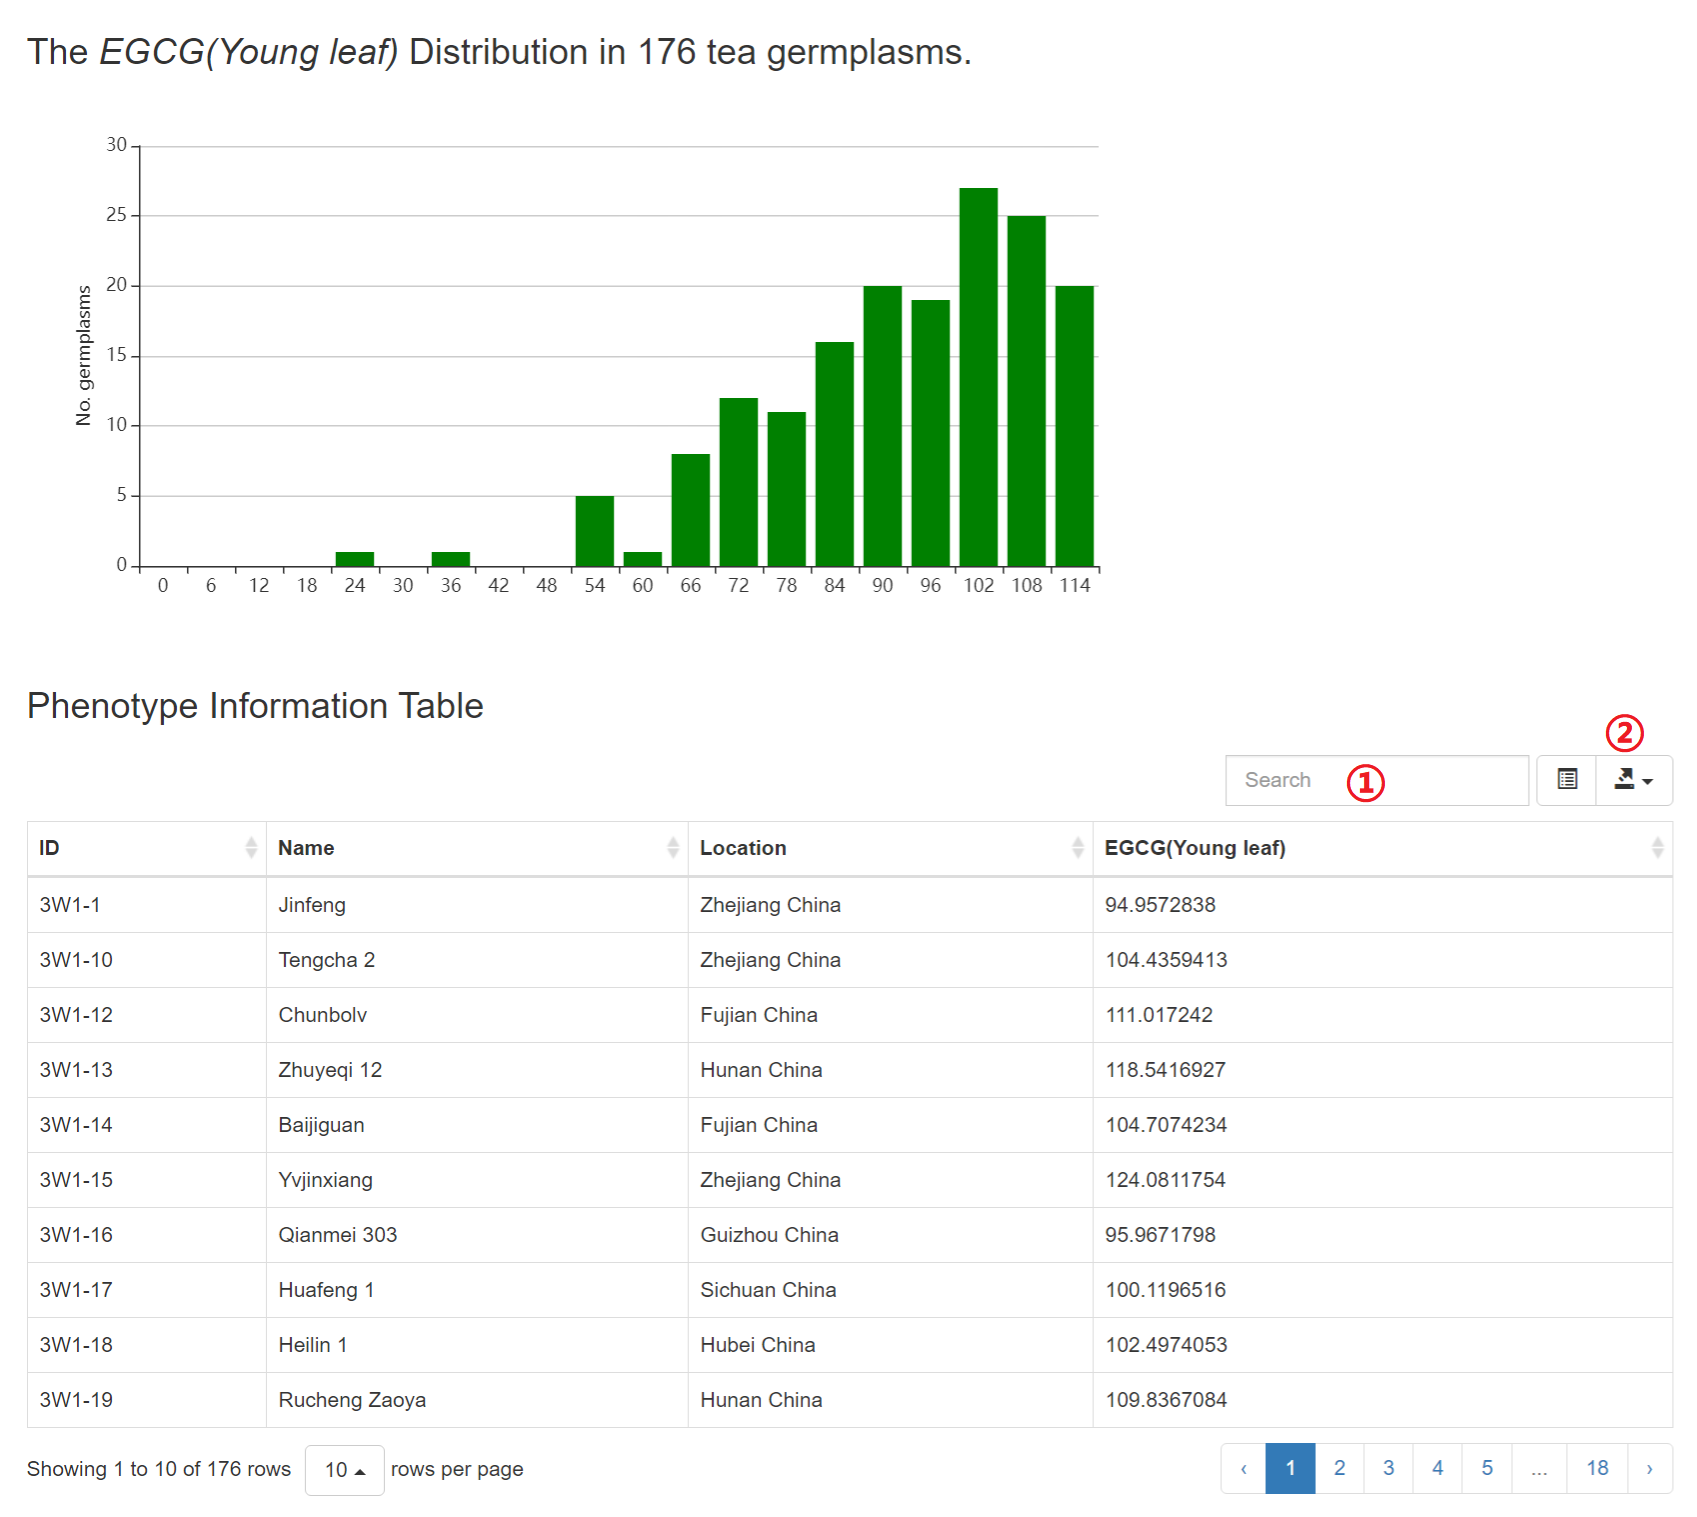
1: Input a keyword to search the table.
2: Click to download JSON, TXT, CSV or Excel file.
The Genome wide association study (GWAS) of more than 400 metabolites were performed and users can retrieve the GWAS results for each metabolite.
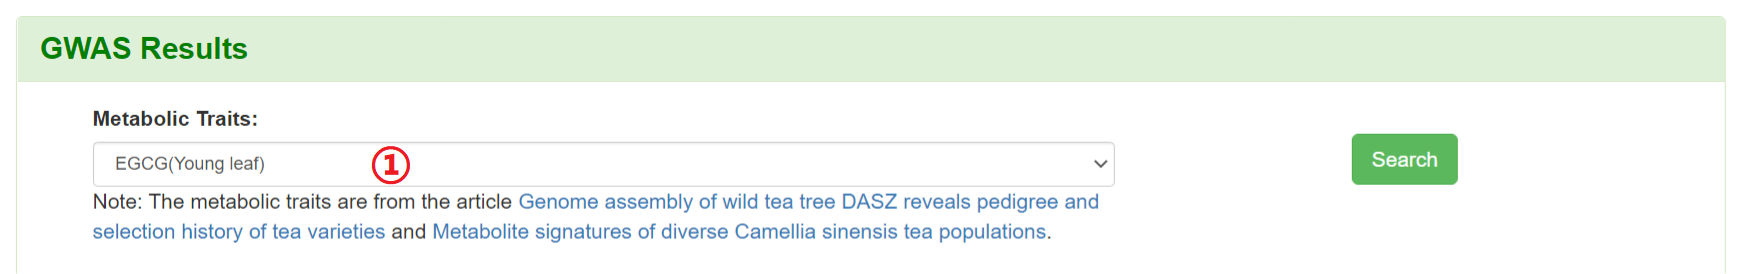
1: Specify a trait of interest. All metabolic traits integrated into the TeaGVD lists in Phenotype Information.
Results of “GWAS Results”
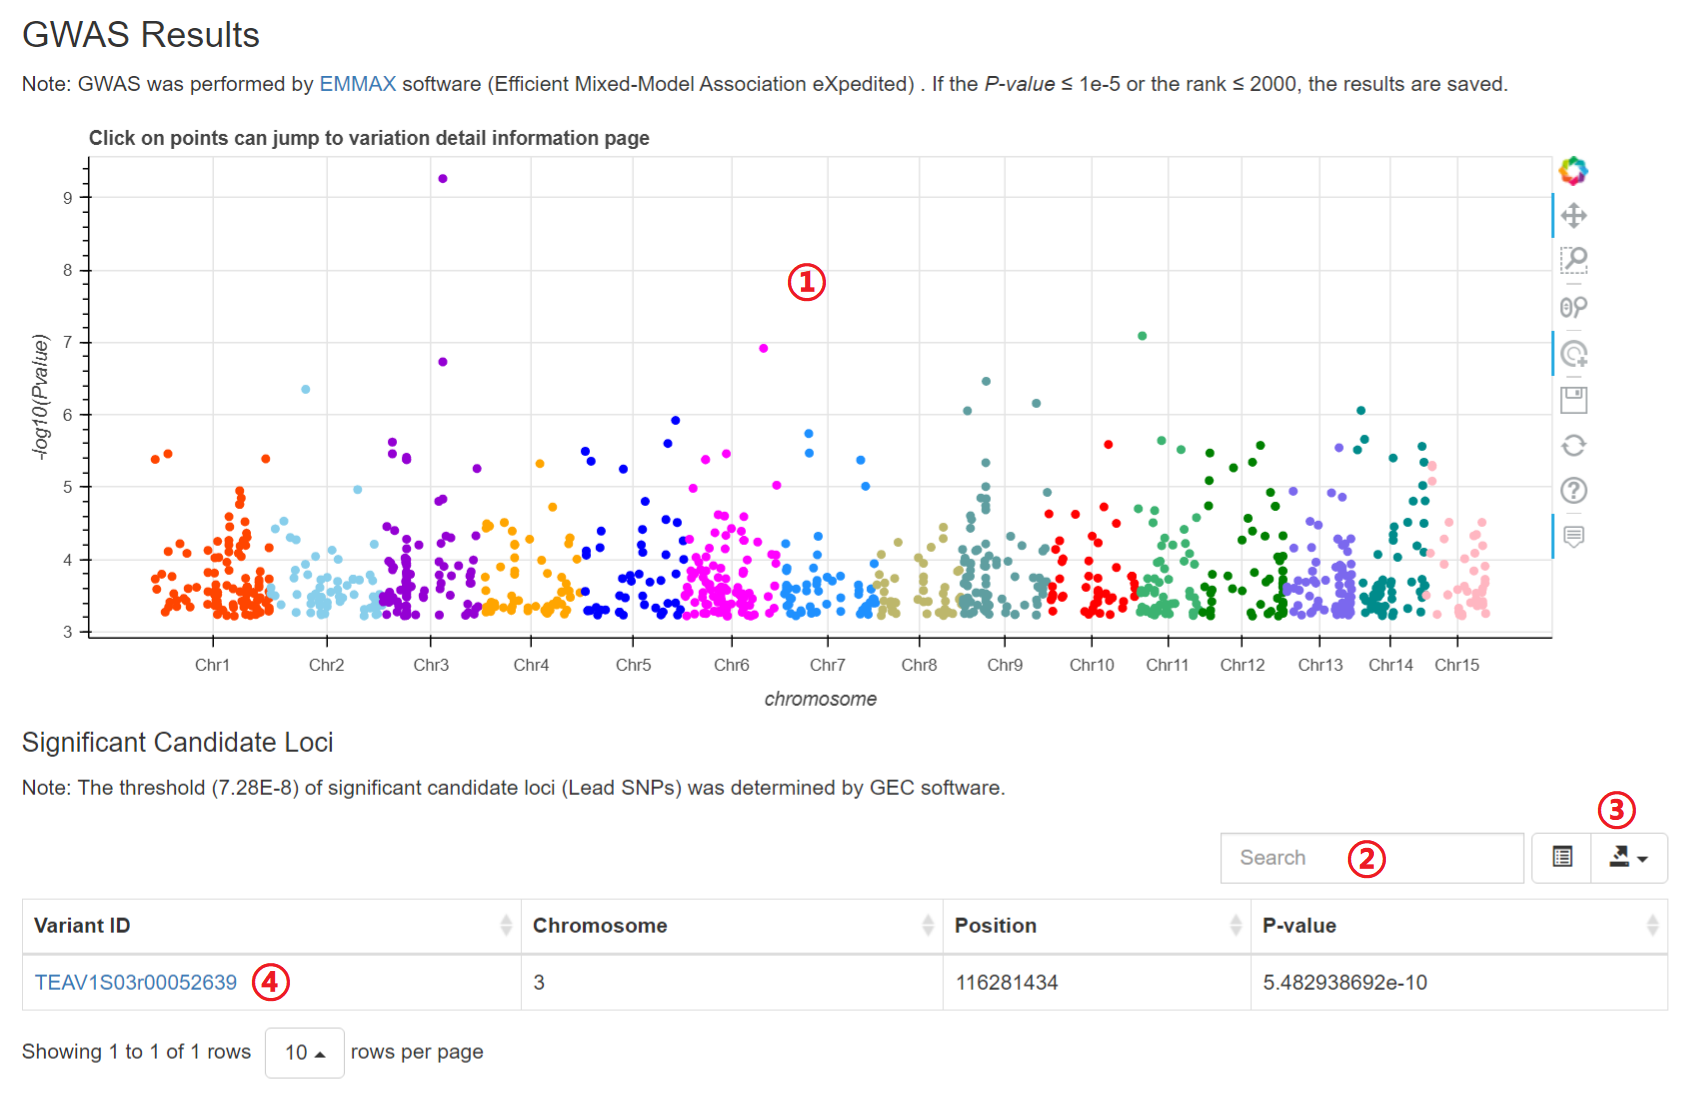
1: Move the mouse can see the basic variation information and click on points can jump to the detail variation information.
2: Input a keyword to search the table.
3: Click to download JSON, TXT, CSV or Excel file.
4: Click on hyperlinks can jump to variation detail information.
Users to find regions of local similarity from genomes, CDS and protein sequences of the reference genomes (Biyun, DASZ, Huangdan, Longjing43, Shuchazao_V1.2_tri, Shuchazao_V2_ahau, Tieguanyin, Yunkang10) by BLAST.
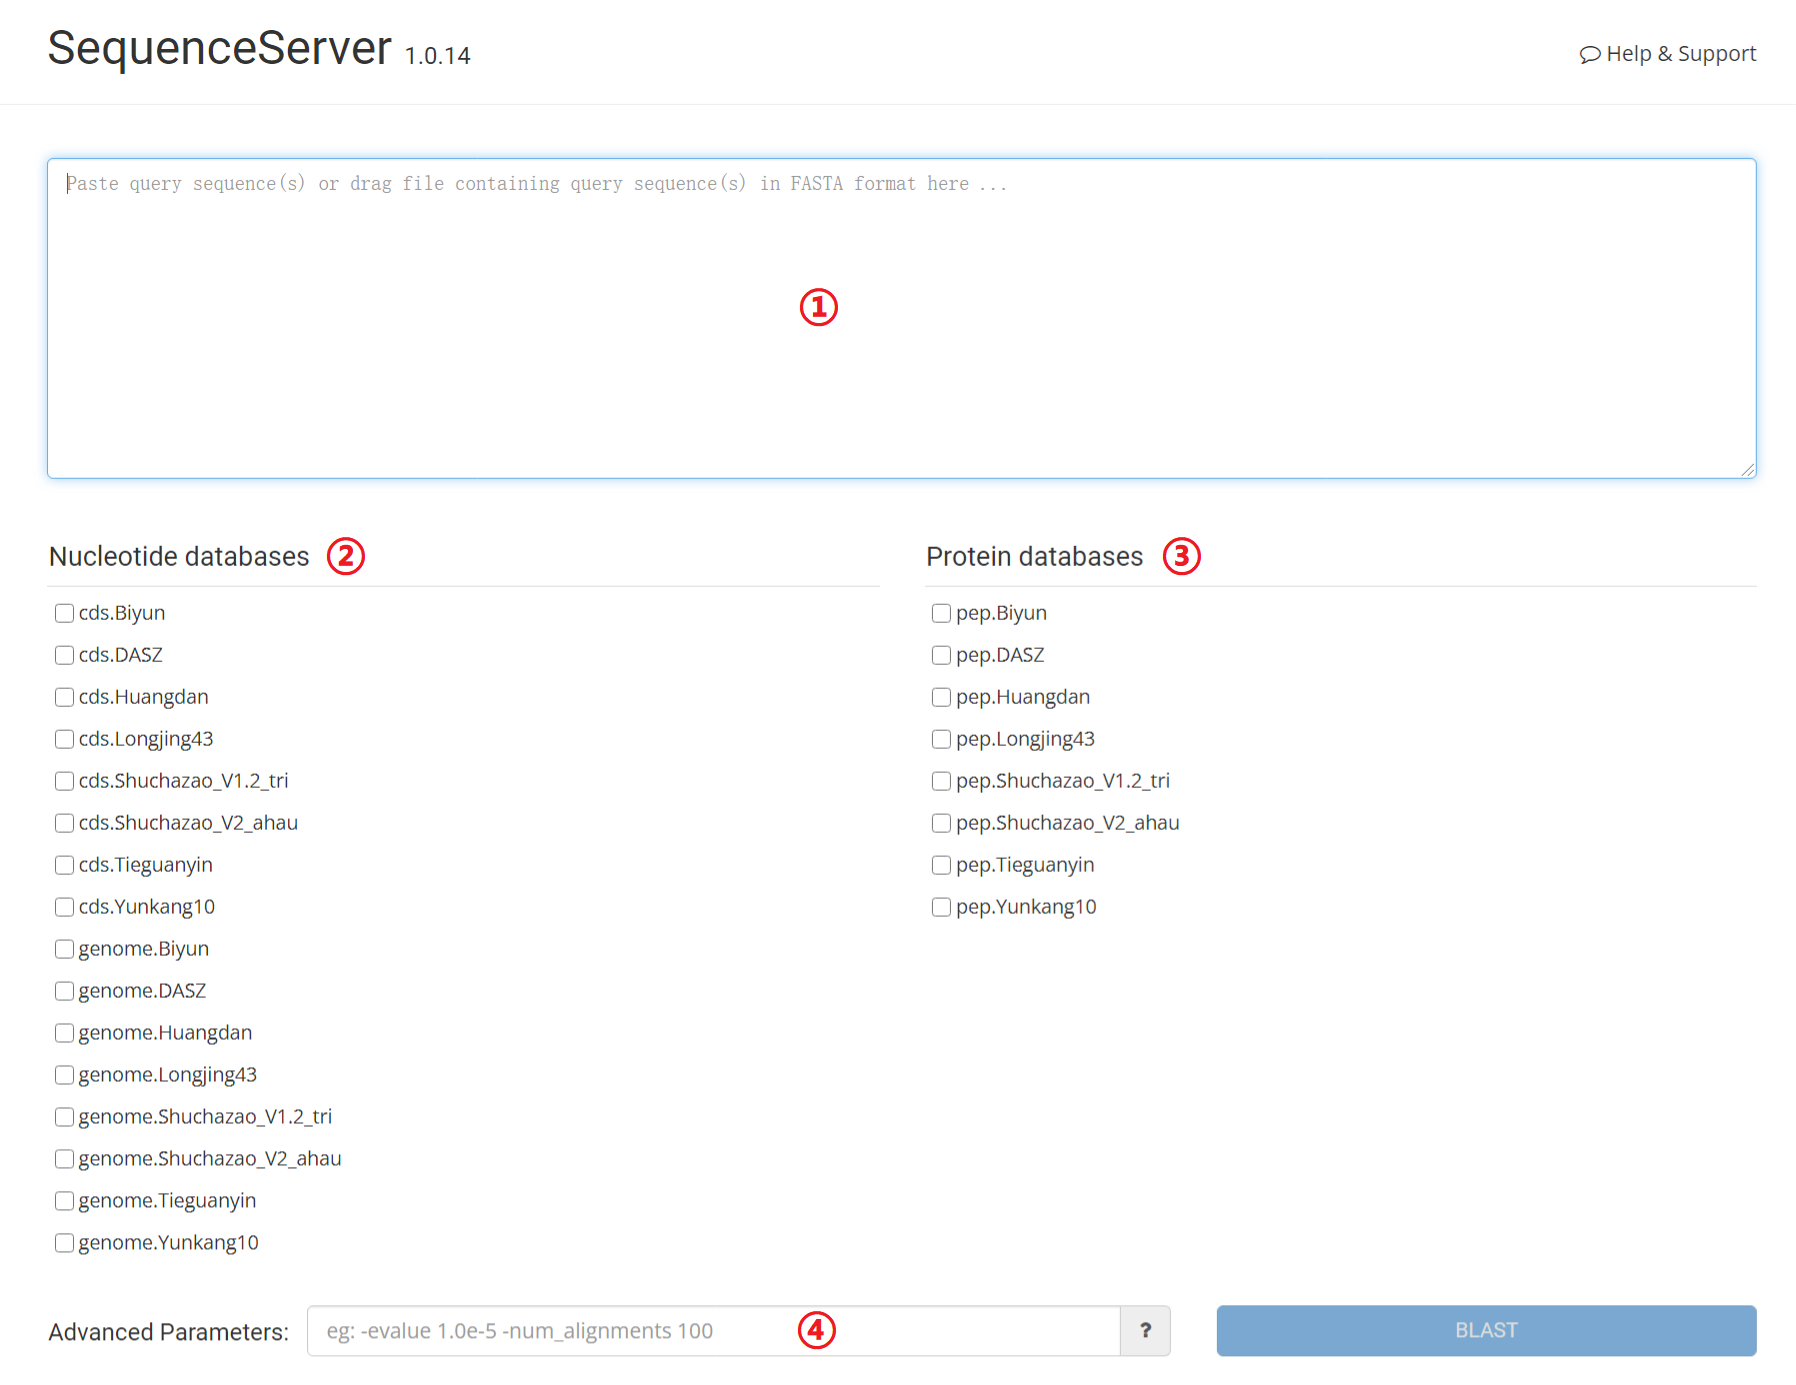
1: Input query sequence.
2: Select one or more nucleotide databases. (conflicts with protein databases)
3: Select one or more protein databases. (conflicts with nucleotide databases)
4: Set parameters for BLAST, e.g. –evaule, -num_alignments. etc. (optional)
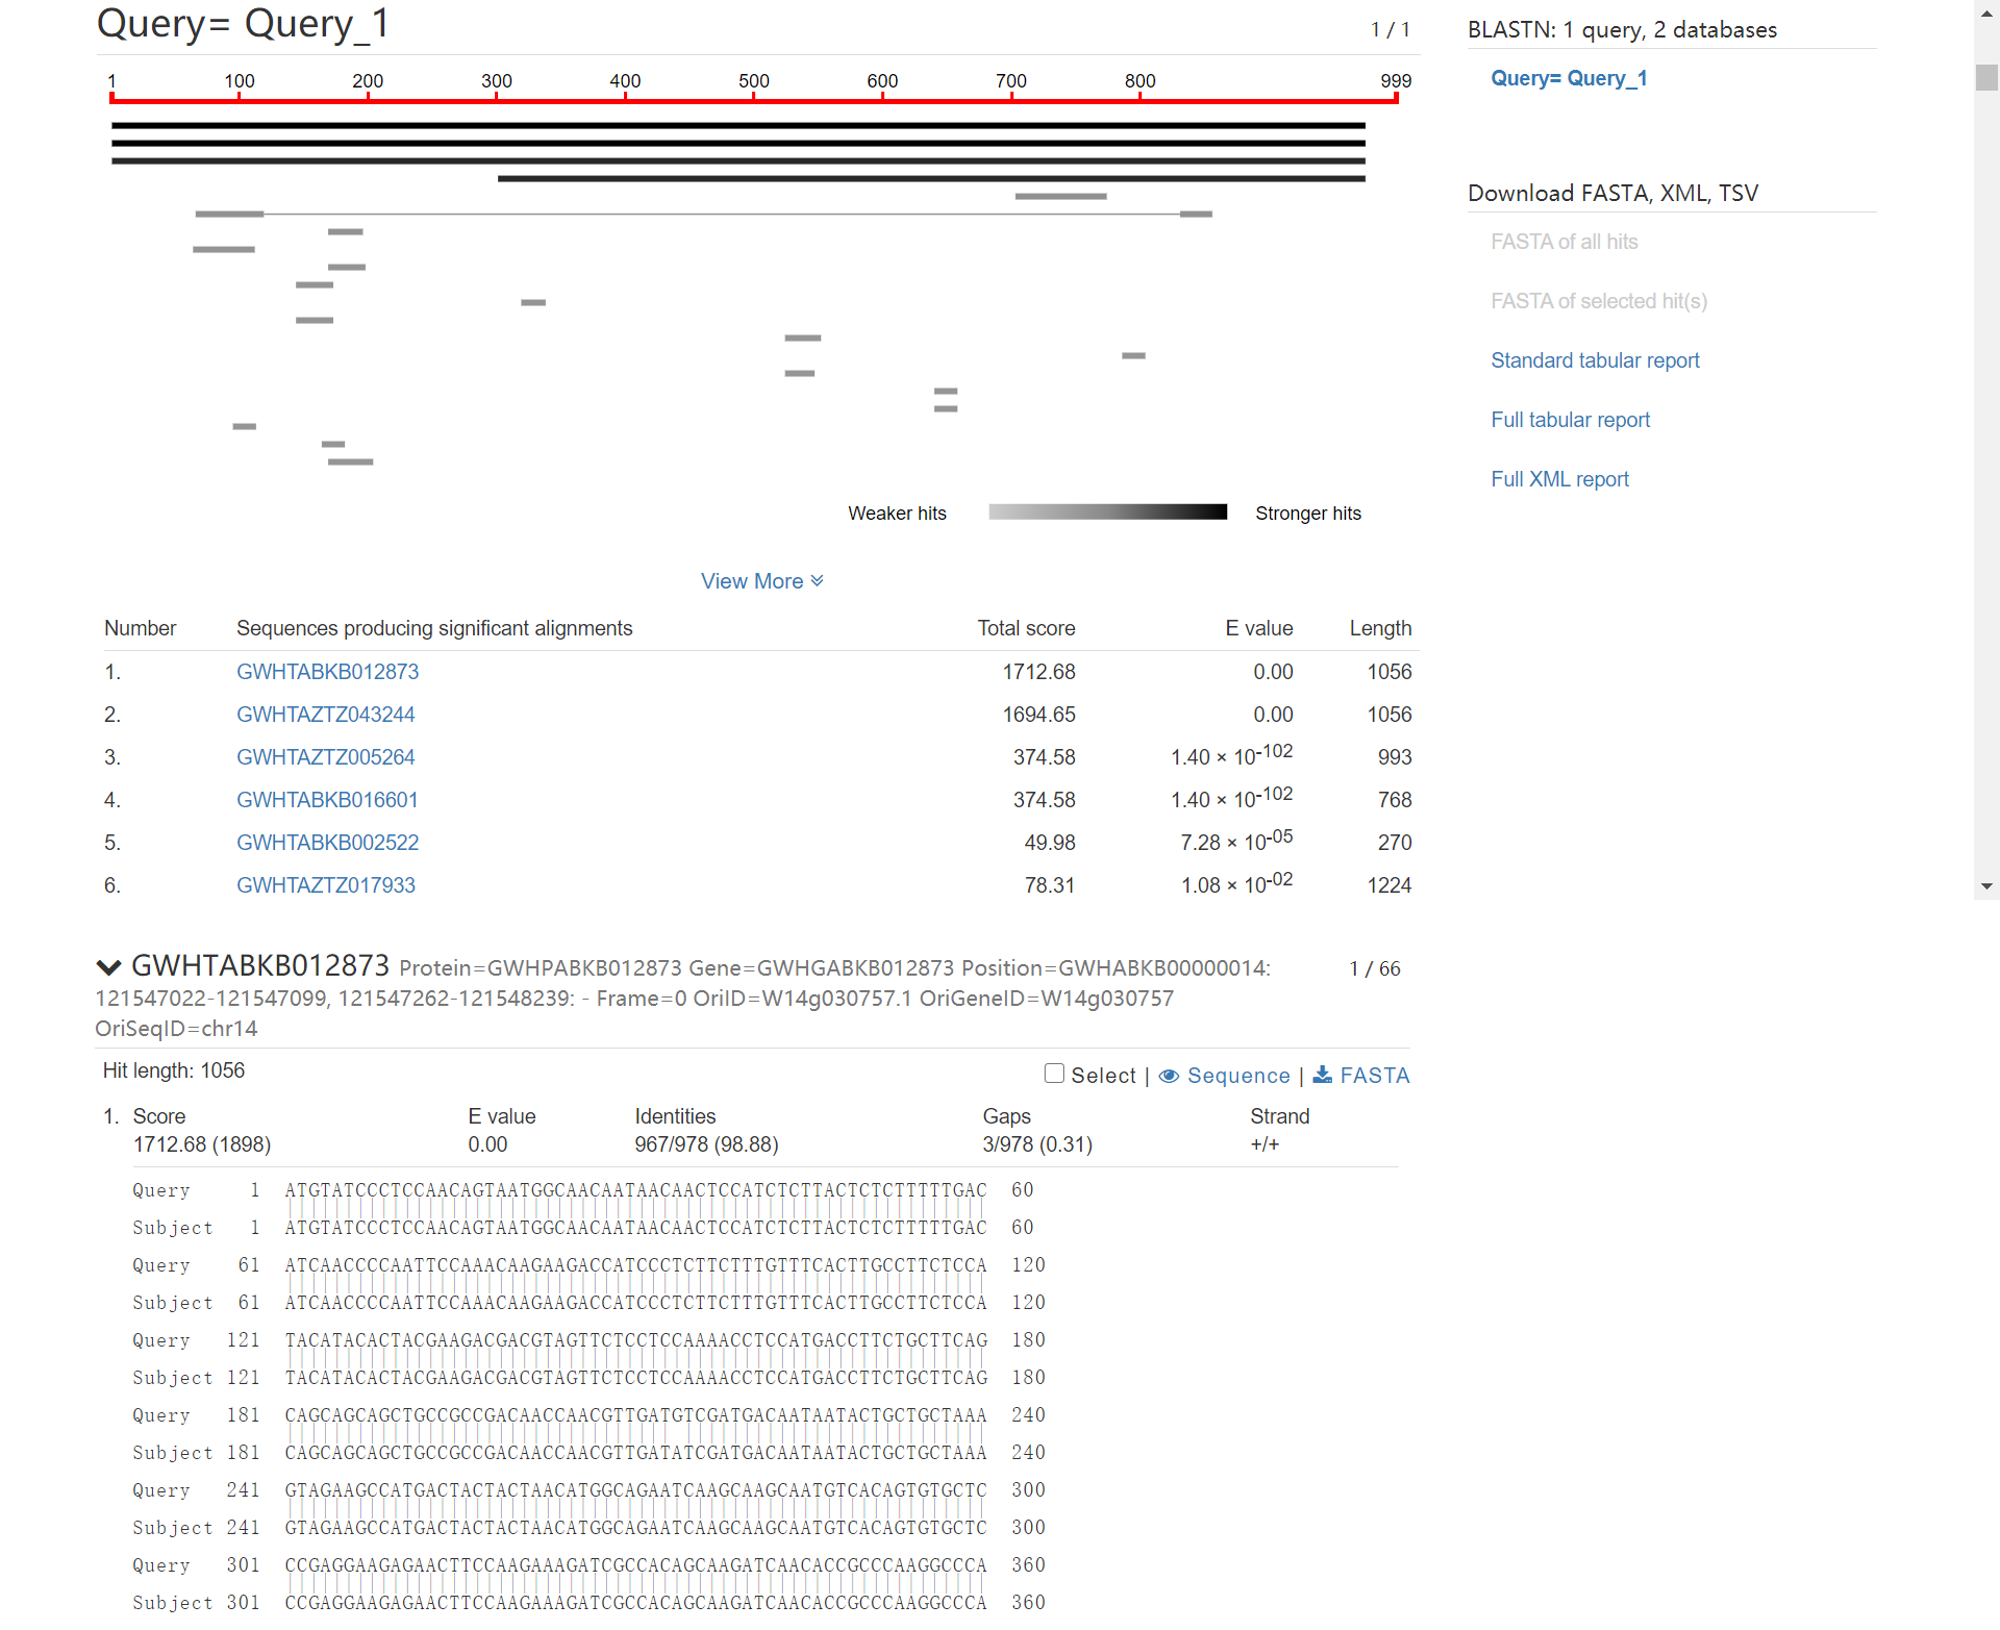
Results of “BLAST”
Users can retrieve sequence by specifying genomic coordinate or gene ID of the public tea genomes. Genomic sequence of the corresponding region or gene-related sequence (CDS, protein sequence, DNA sequence and its flanking sequence) will present in the webpage by this tool. Users can also fetch sequence by limiting customized sequence and its genomic coordinates.
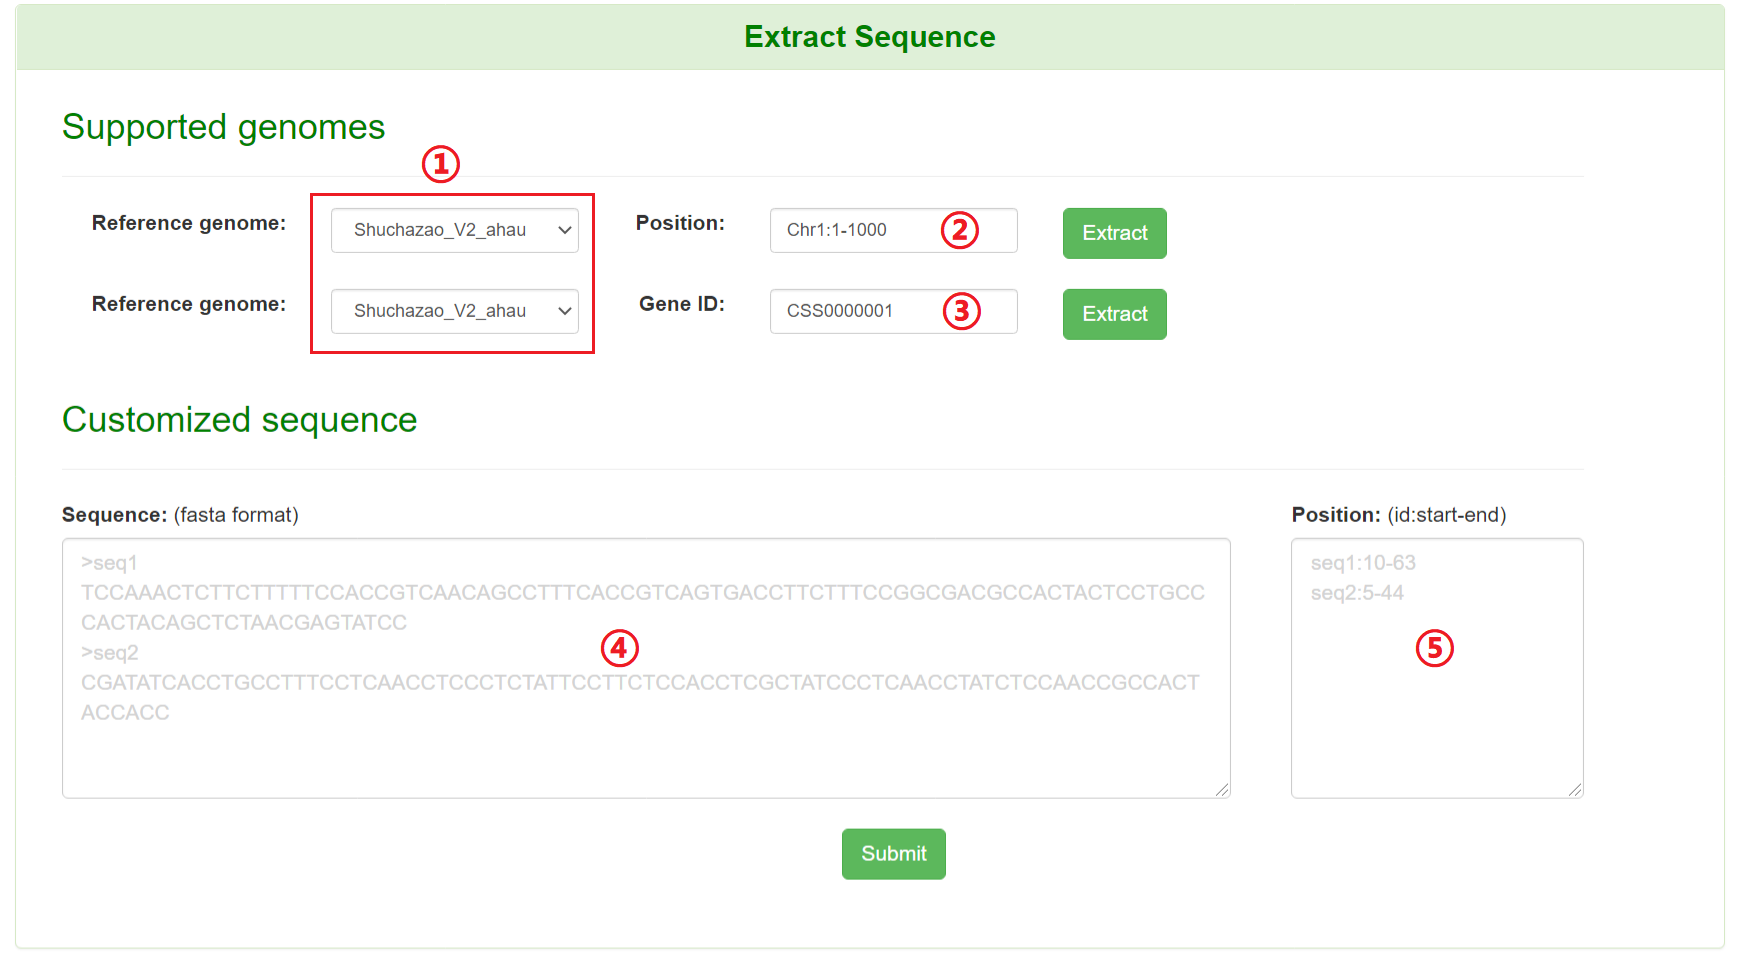
1: Specify a reference genome.
2: Input a chromosome region (chromosome:start-end).
3: Input a gene ID.
4: Input customized sequences.
5: Input regions of the corresponding customized sequence ID.
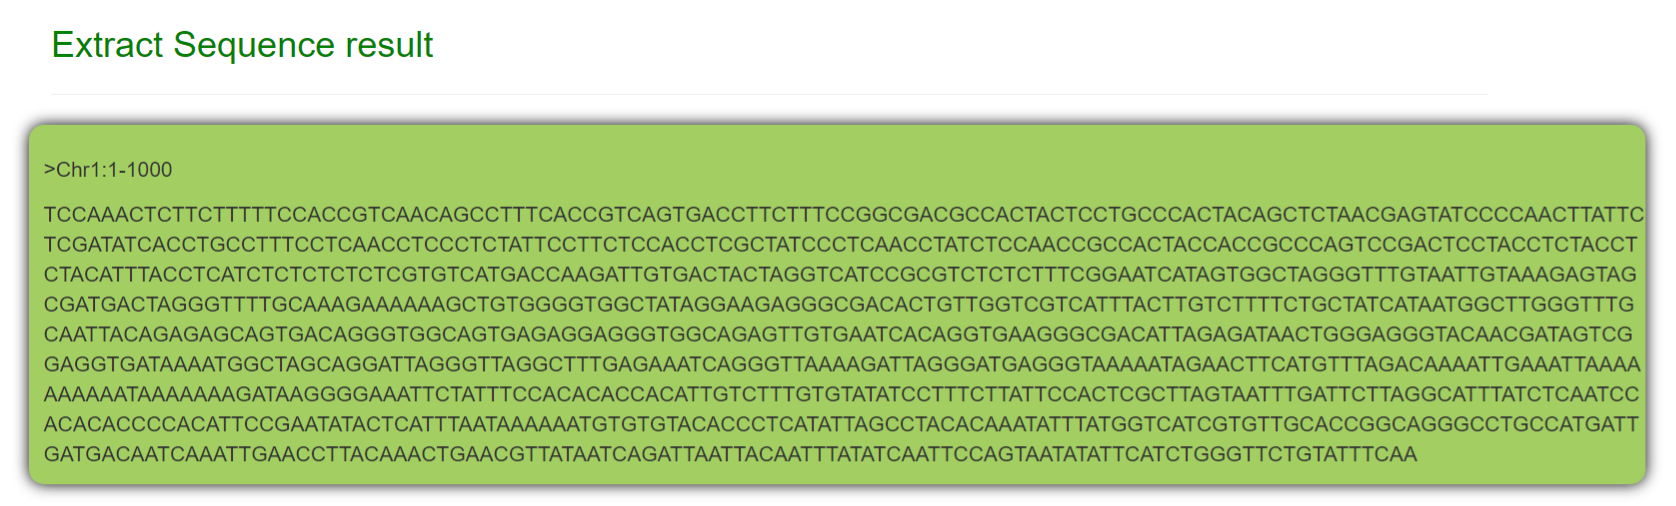
Results of “Extract Sequence”

Users can pick PCR primers to develop polymorphism primer by specifying genomic coordinate or variation ID and its flanking region.
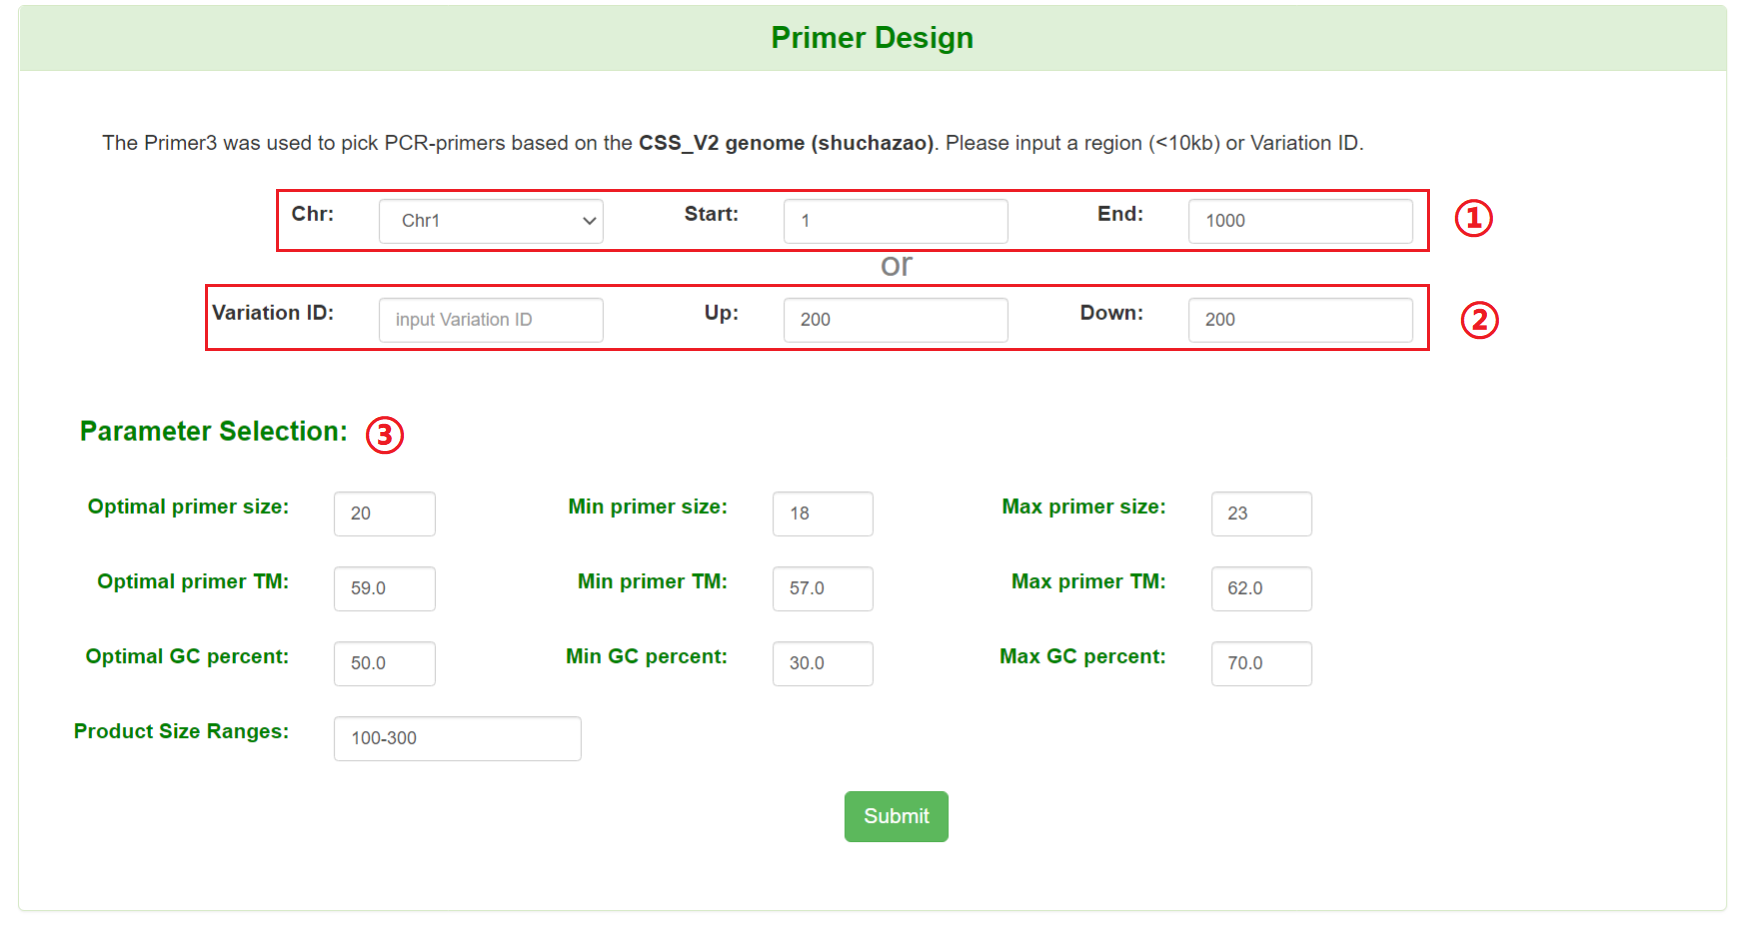
1: Specify a chromosome and input a region.
2: Input a variation ID and flanking regions.
3: Set parameters for designing primer. (optional)
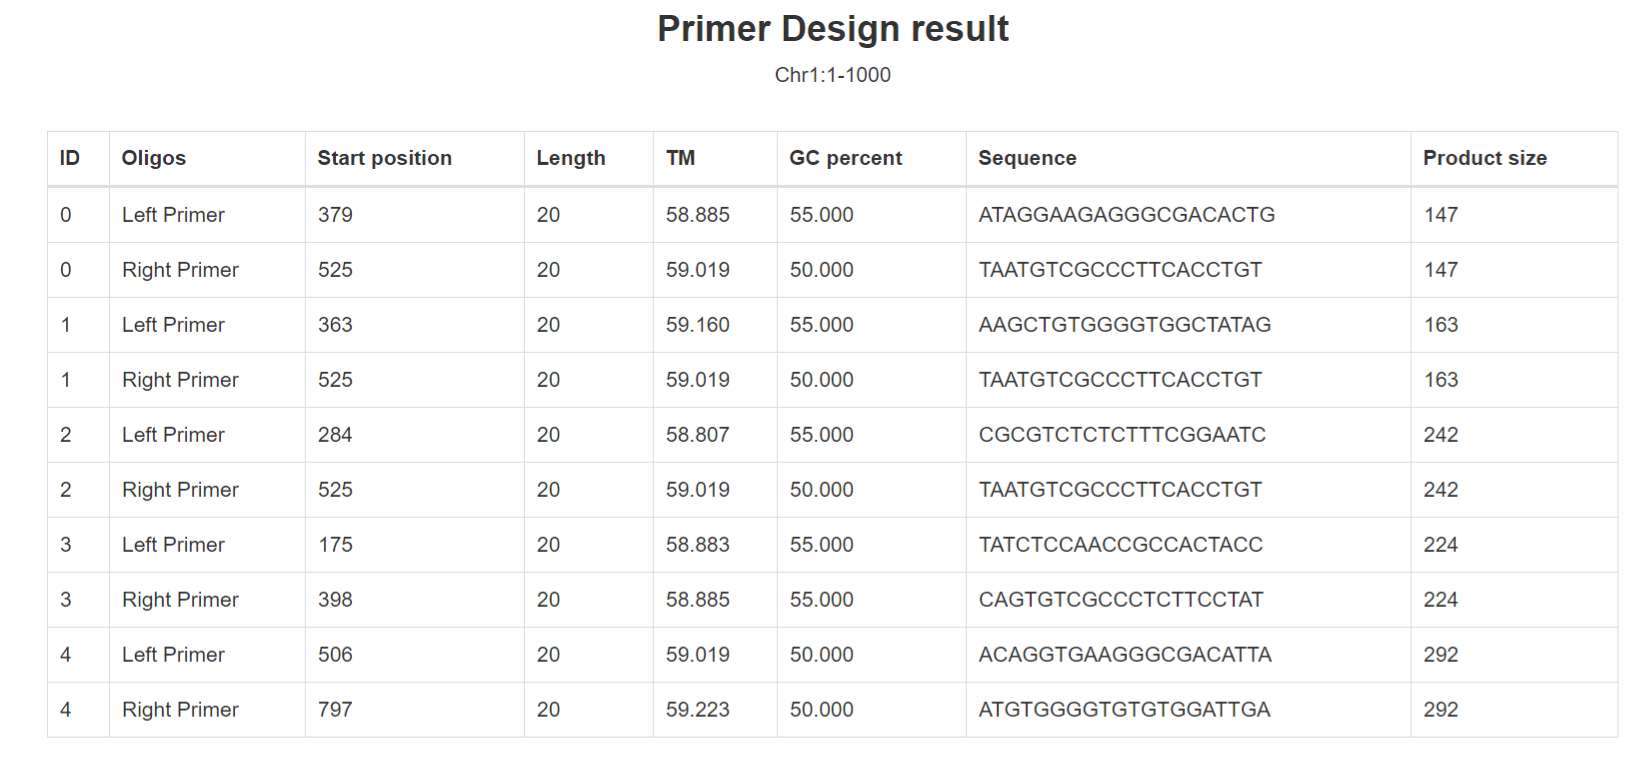
Results of “Primer Design”
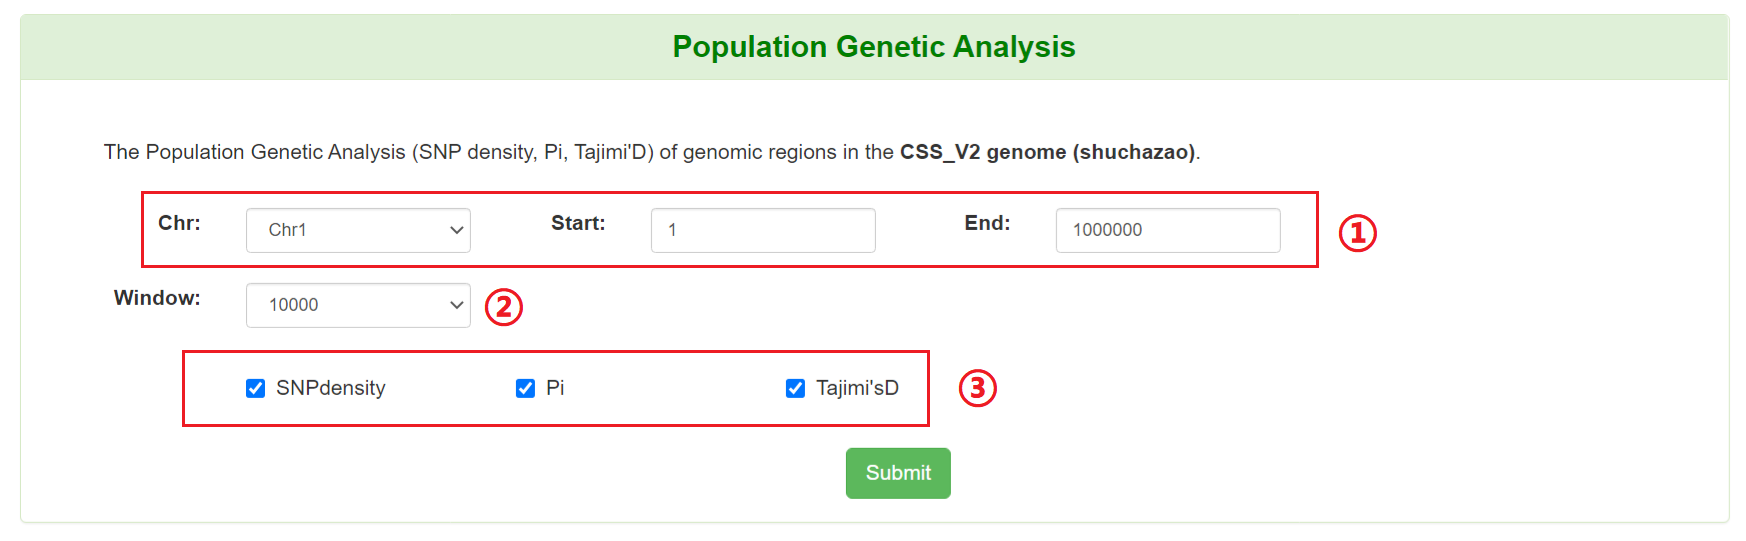
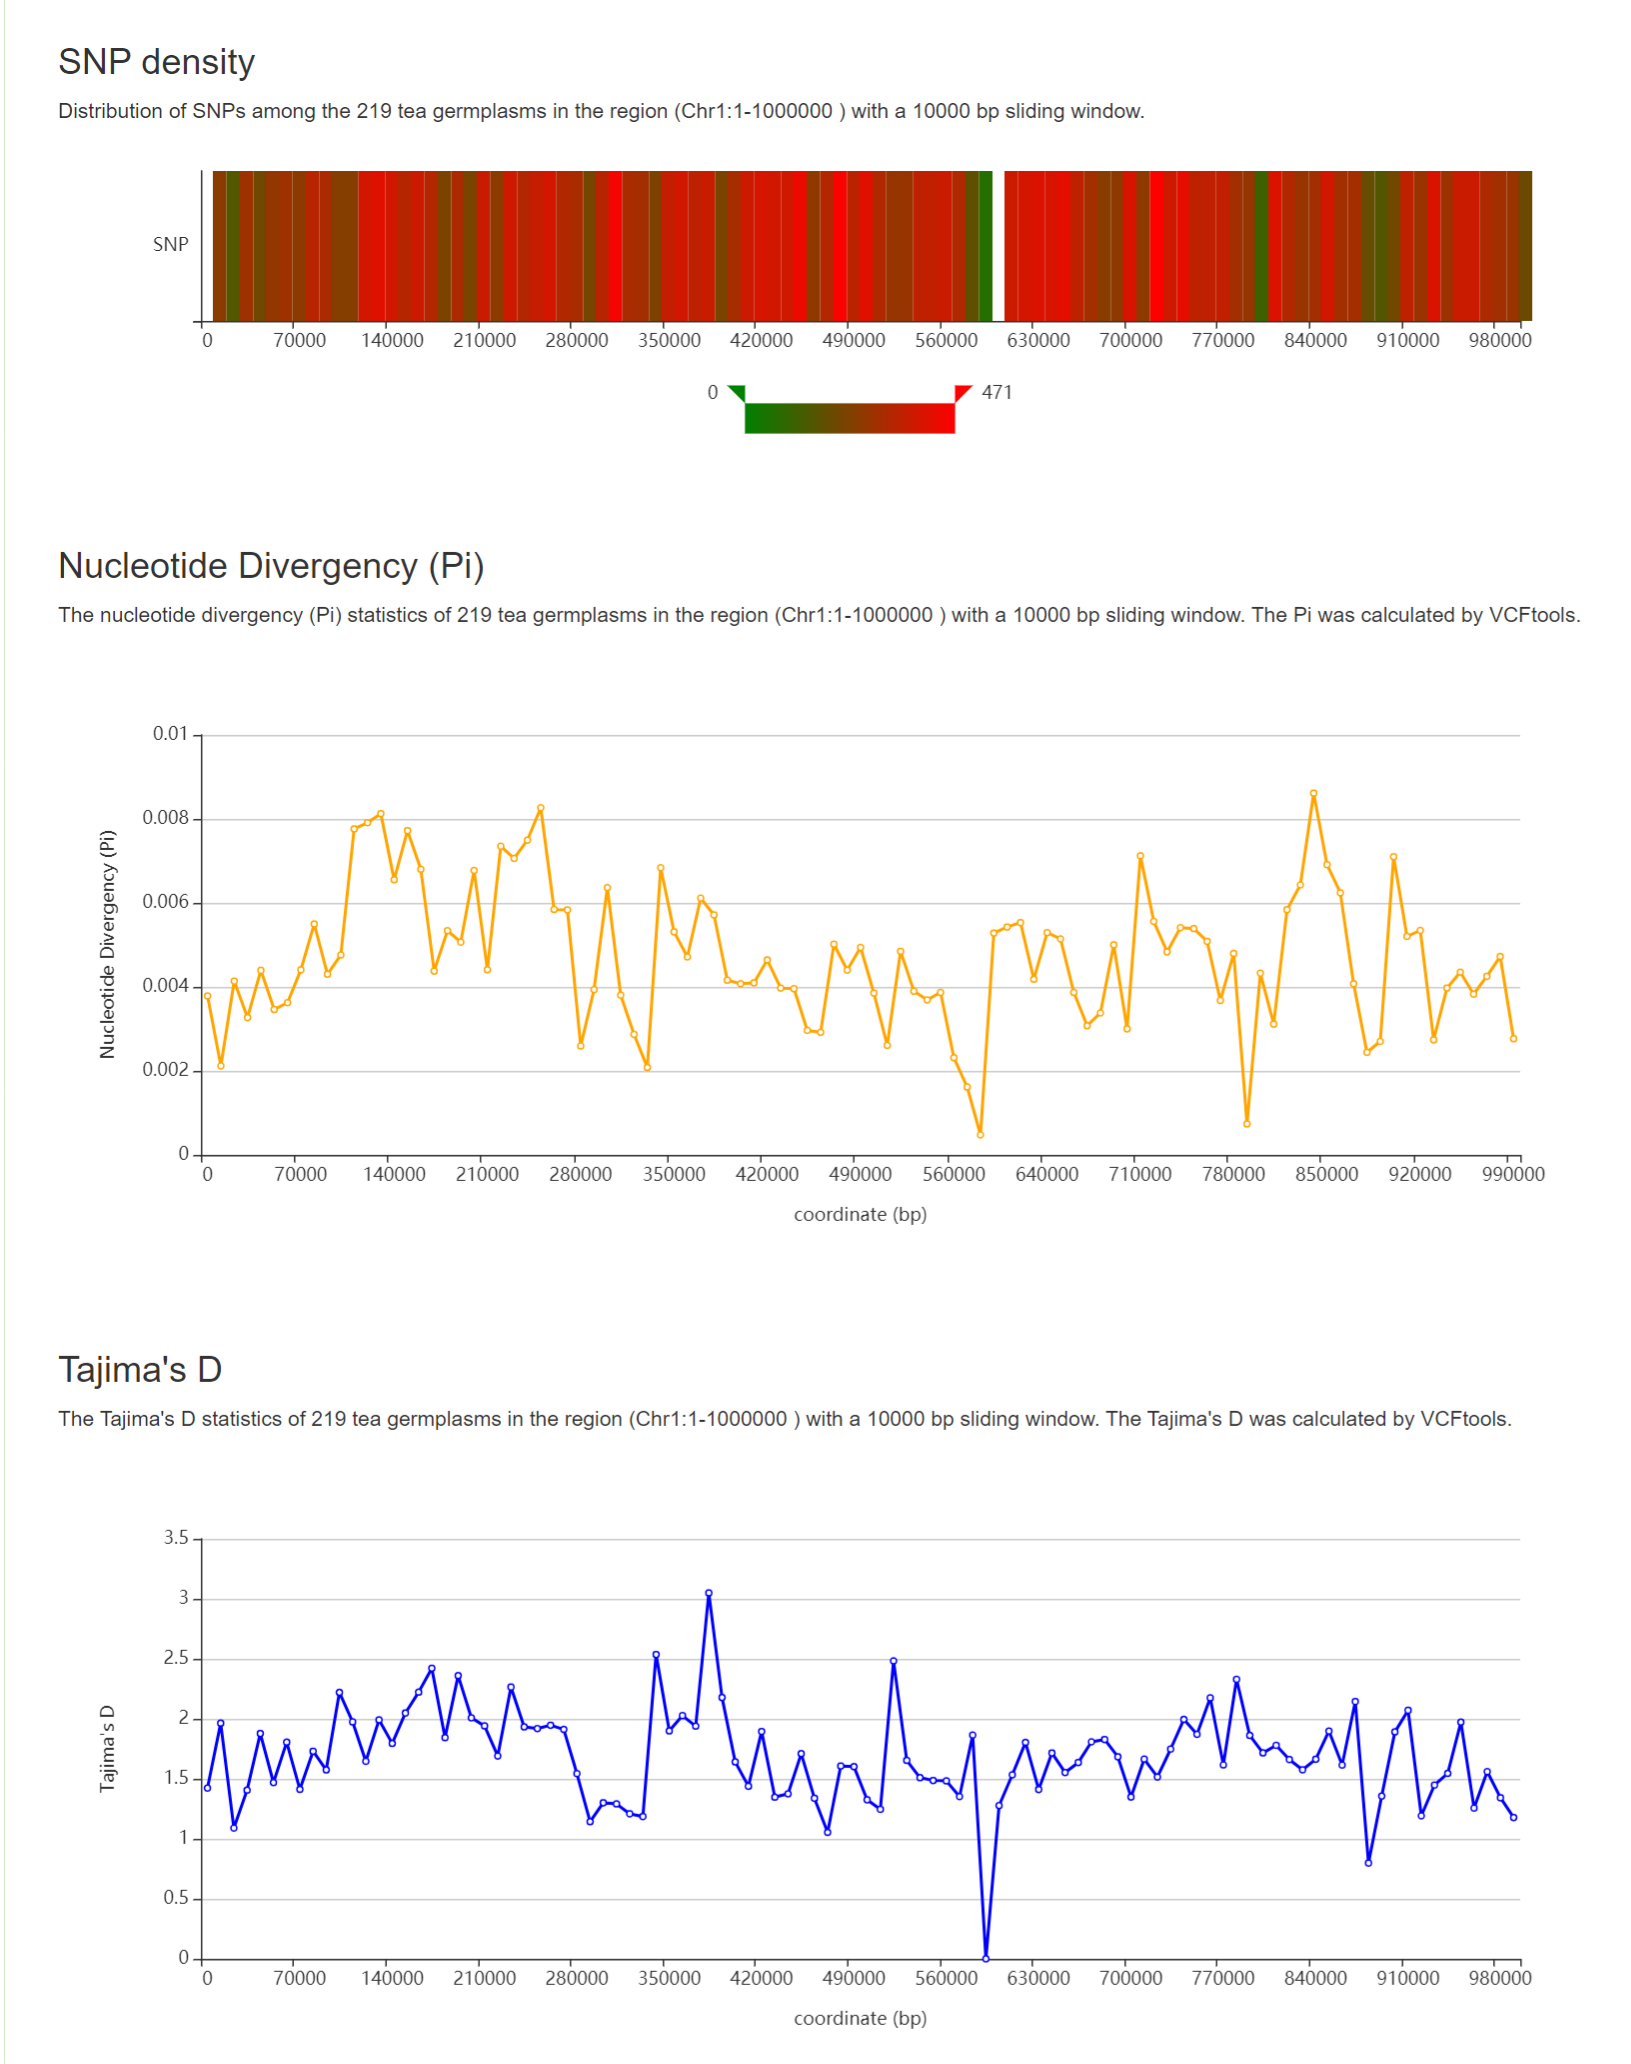
1: Specify a chromosome and input a region.
2: Select a window size from 1 kb, 10 kb, 100 kb and 1000 kb for population genetic analysis.
3: Select statistical methods for each window.
Results of “Population Genetic Analysis”